1. Introduction
A/B testing is a fundamental technique for comparing two or more versions of a webpage, app feature, or product to determine which performs better. It allows us to evaluate the difference in user interactions and assess the relevant metrics.
In this tutorial, we’ll explore the concept of A/B testing, how it works, and why it’s essential for improving user experience and boosting performance metrics (such as conversion rates).
2. Overview
A/B testing is also called split testing. The idea is to segment the audience (users, customers) into two groups and present each group with a distinct version of a product or feature. The objective is to analyze which version yields a more favorable result according to specific metrics.
For example, an e-commerce site may test two variations of a “Buy Now” button, red and blue, to see which color leads to more purchases.
A/B testing is widely used to make data-driven improvements in web development, marketing, UX design, and app development.
We can define more than two groups. The principles will remain the same, but the statistical tools for analysis will be different.
3. How A/B Testing Works
The process of A/B testing typically follows these steps:
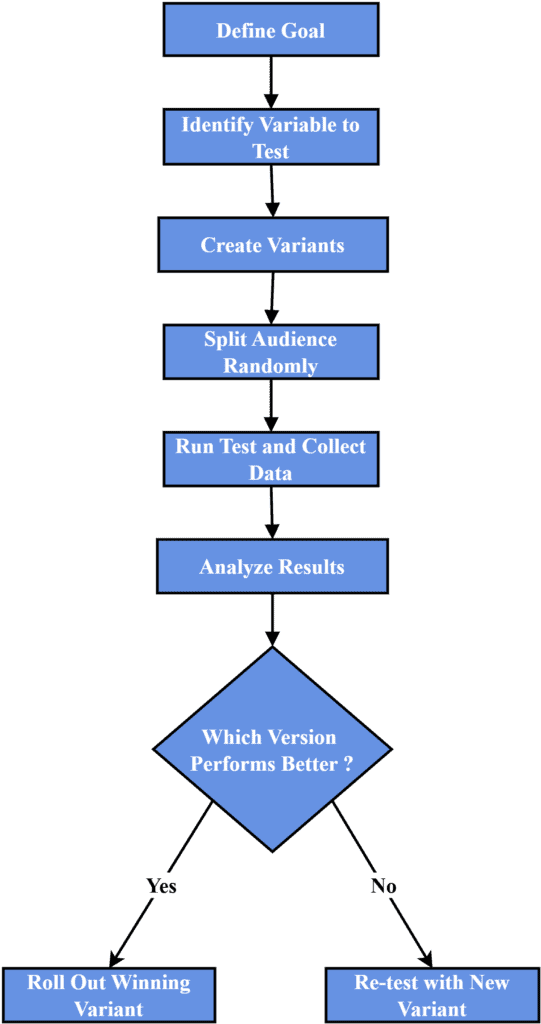
Let’s take a look at each of these steps in more detail.
3.1. Step 1: Define the Goals
First, we need to establish our goals. They vary depending on our business needs. For example, we may want to increase click-through rates or improve sign-ups and purchases.
By clearly defining our goals, we provide direction for the test that helps us measure success effectively.
3.2. Step 2: Identify the Variable
Next, we identify the element we want to test. In A/B testing, “variable” refers to the specific element we modify to observe its impact.
It’s essential to focus on one variable at a time, as testing multiple variables simultaneously can couple their effects. Coupling makes it impossible to determine which variable drives the change or whether all variables or only a subset is significant.
Some examples of variables we can test include:
- Headlines: Does a bold headline attract more attention?
- Call-to-Action (CTA) Buttons: Which color drives more clicks?
- Images or Videos: Does visual content improve engagement?
- Form Length: Do shorter forms lead to more sign-ups?
3.3. Step 3: Create Variants
In this step, we create two versions of the element we identified.
For example, Version A can serve as the control, while Version B introduces a single modification. It can be as simple as changing the color of a CTA button from blue in Version A to red in Version B.
3.4. Step 4: Split the Audience
To ensure unbiased results, we randomly divide our audience into two groups. One group sees Version A, while the other is shown Version B. This split is intended to allow for an objective comparison between the two versions.
If the split isn’t random, the populations in the A and B groups may differ, and any observed effects could be due to group differences rather than the variable.
We can use tools like Optimizely or OptiMonk to automate this process and distribute traffic evenly across both versions.
3.5. Step 5: Collect Data
We gather data on key performance indicators (KPIs) as users interact with each variant. These could include metrics such as conversion rates, click-through rates, bounce rates, or engagement times.
It’s crucial to let the test run long enough to collect a sufficiently large dataset.
3.6. Step 6: Analyze the Results
Once the test concludes, we analyze the data to determine which version performed better.
Statistical tools can help us assess confidence levels, ensuring that the observed differences are not due to chance.
4. Example of A/B Testing
Let’s walk through a real-world example of optimizing a landing page for an e-commerce store.
4.1. Scenario
Let’s assume our e-commerce site is experiencing a high bounce rate on its summer sale landing page. Despite offering significant discounts, users are not engaging with the page as expected.
We hypothesize that updating the headline and modifying the CTA button might encourage users to stay on the page longer and complete more purchases.
We set a clear goal. For example, we aim to increase conversions by 15% during the summer sale period.
4.2. Test Variable
We choose to experiment with the headline:
- Control (Version A): Current headline – “Exclusive Summer Sale – Up to 50% Off!”
- Variant (Version B): New headline – “Summer Sale Ends Soon – Shop Now!”
4.3. Execution
First**,** we divide the incoming traffic evenly, with 50% of visitors seeing Version A and the remaining 50% experiencing Version B. Next, we conduct the test over two weeks, allowing us to gather a large enough sample size to ensure reliable results.
To measure the impact of the headline change, we track different metrics, such as click-through rate (CTR) on the headline, bounce rate, and conversion rate (number of purchases).
4.4. Results and Analysis
After two weeks, we gather the data and analyze the results:
Metric
Version A (Control)
Version B (Variant)
Absolute Difference
Relative Difference
Visitors
5,000
5,000
–
Conversion Rate (%)
2.5
3.2
+0.7%
+28%
Bounce Rate (%)
60
50
-10%
-16.7%
Click-through Rate (CTR) (%)
12
18
+6%
+50%
To determine whether these differences are statistically significant, we can use a two-proportion z-test. This test evaluates whether the proportions observed in Version A and Version B differ significantly.
For this test, we use a one-tailed z-test because we are specifically interested in whether Version B outperforms Version A. For all three metrics, the test hypotheses are as follows:
- the null hypothesis is that Version A outperforms Version B or performs the same as it
- the alternative hypothesis is that Version B outperforms Version A
Low p-values are considered indicators that the null hypothesis should be rejected and the alternative hypothesis accepted. For our three metrics, the p-values are below 0.05, favoring Version B.
However, with large sample sizes, random fluctuations can result in statistically significant p-values for small differences. Therefore, we should consider both p-values and effect size. The latter estimates the real-world impact of the observed improvements. The relative differences indicate moderate-to-large effects for conversion rate and CTR and a smaller but meaningful effect for bounce rate. The absolute differences also suggest that the effects are substantial.
Version B achieved a 28% higher conversion rate than Version A, with a 16.7% reduction in bounce rate and a 50% improvement in click-through rate. Based on these results, we recommend rolling out Version B to all users.
5. Advantages and Disadvantages of A/B Testing
A/B testing serves as a foundation for continuous improvement. In competitive markets, even minor enhancements can lead to significant gains. Let’s examine some of the advantages and disadvantages of A/B testing.
5.1. Advantages of A/B Testing
One of the key benefits is the ability to enhance user experience. By testing different variations of design elements and functionalities, we can identify the version that resonates most with users. This ensures the final product delivers the best possible experience, fostering higher engagement and satisfaction.
A/B testing is also instrumental in boosting conversion rates. Testing variations of CTAs, headlines, or form layouts allows us to determine which elements drive more clicks, sign-ups, or purchases. This iterative process gradually improves overall performance and revenue.
Another advantage is that A/B testing helps mitigate risks. Instead of rolling out large changes simultaneously, we can implement incremental updates. If a variation underperforms, we can quickly revert to the original, minimizing any potential negative impact on engagement or sales.
5.2. Disadvantages of A/B Testing
Despite its many benefits, A/B testing has challenges.
One significant drawback is that it can be time-consuming and resource-intensive. Running tests, especially for lower-traffic sites, often require weeks or months to gather enough data for a meaningful analysis.
Additionally, testing wrong variables can lead to wasted effort. Not all changes will drive noticeable improvements, and focusing on minor, low-impact elements can divert resources away from more critical optimizations.
A/B testing can also encourage a short-term focus. While small wins are valuable, relying solely on incremental changes may prevent us from pursuing more significant, innovative redesigns that could drive long-term growth.
Another common issue is conflicting results or statistical noise. External factors, such as seasonal trends or marketing campaigns, can affect test outcomes, leading to misleading conclusions. To mitigate this, we can plan tests to span multiple seasons, ensuring the data reflects a more balanced perspective.
Tests with small sample sizes are particularly susceptible to inaccurate results. Therefore, we should ensure sufficient sample sizes and combine A/B testing with complementary research methods, such as user interviews or surveys, to validate our findings.
6. Conclusion
In this article, we explored how A/B testing can enhance user experience and guide us in making data-driven decisions to improve product performance, such as conversion rates. Whether we’re optimizing website layouts, email campaigns, or app features, A/B testing is a valuable tool for continuous growth and improvement.
A/B testing is an iterative process that fosters continuous growth. Each test provides insights that can inform future experiments. However, we shouldn’t make the tests too granular. It’s essential to strike a balance. We should prioritize testing elements with the highest potential for impact, allow tests to run long enough to gather reliable data, and complement A/B testing with other ways to collect user feedback.