1. Introduction
Traceroute (on Unix/Linux) and Tracert (on Windows) are invaluable tools for diagnosing network issues, providing a detailed view of the route packets take from source to destination. By sending packets with increasing Time-To-Live (TTL) values, Traceroute tracks every intermediate router in the path. It helps network engineers identify where problems lie – whether at a specific hop, due to routing issues, or overall network performance bottlenecks.
However, despite its utility, Traceroute/Tracert isn’t perfect. These tools have limitations that can lead to incomplete or inaccurate representations of the network path.
In this tutorial, we’ll explore Traceroute/Tracert’s key limitations, illustrating common pitfalls, examples, and code snippets to understand its constraints.
2. How Traceroute/Tracert Works
Traceroute was developed in 1988 by Van Jacobson and has since become a fundamental tool for network diagnostics. Today, despite the availability of advanced networking tools, Traceroute remains an indispensable tool for network engineers.
Before discussing the limitations, it’s essential to understand how Traceroute and Tracert work. Both tools send packets with incrementally increasing TTL values.
Traceroute works as follows:
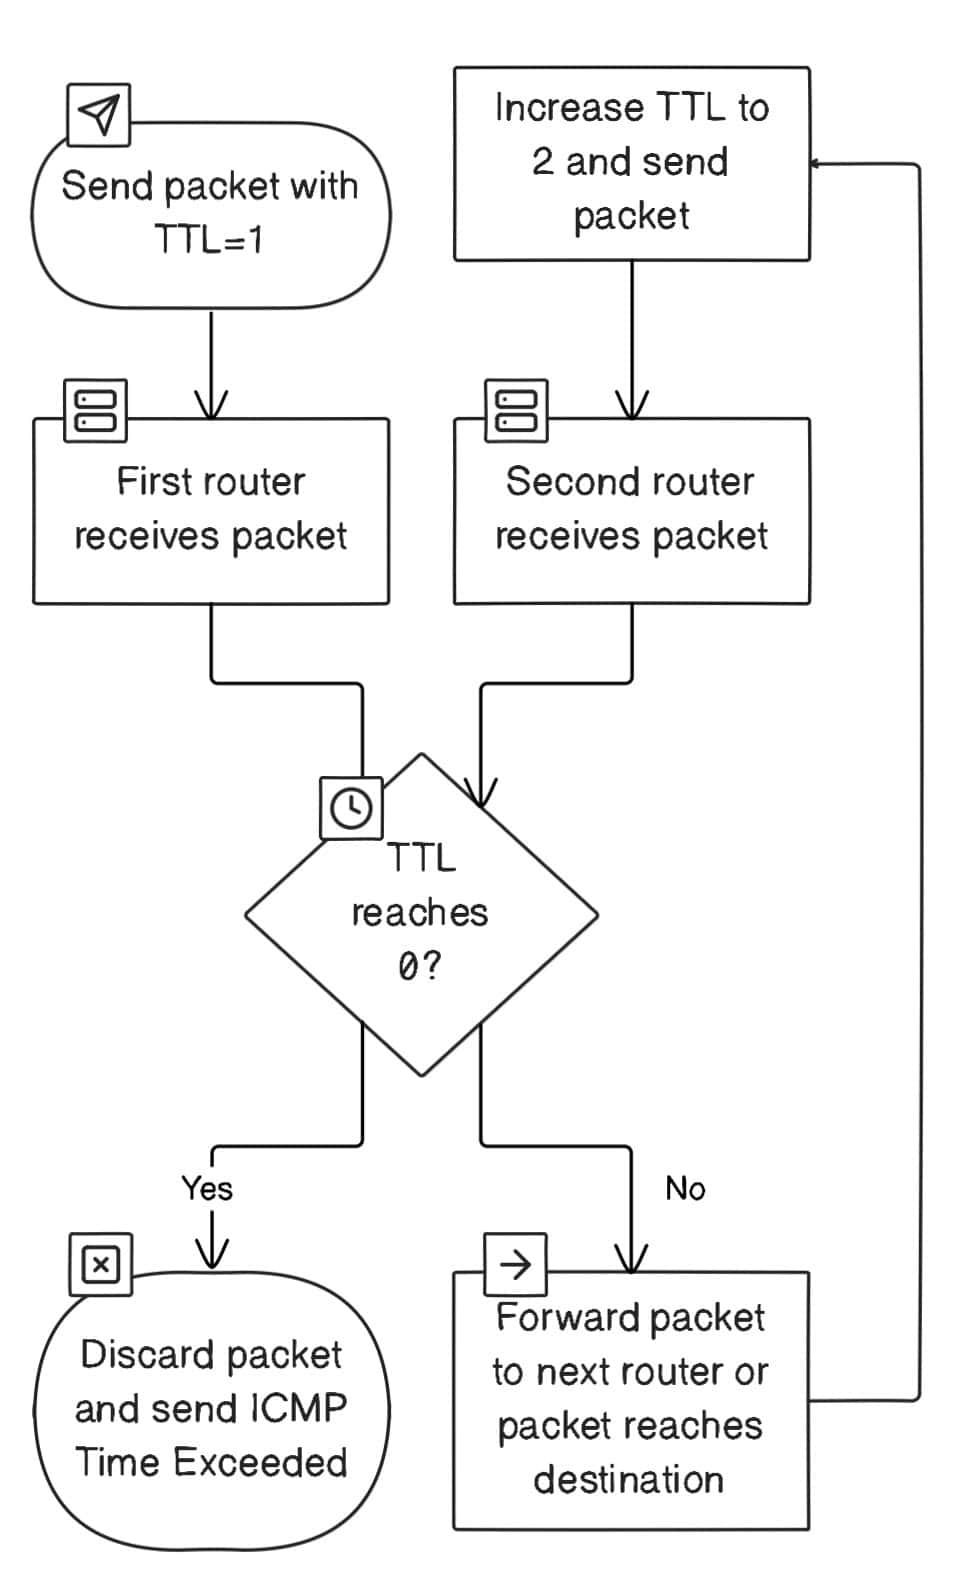
The tool sends a packet with a TTL of 1. When the first router receives it, the TTL reaches 0, and the router discards the packet and sends back an ICMP “Time Exceeded” message to the source.
Traceroute then increases the TTL to 2 and sends another packet, which passes through the first router and is discarded at the second one. This process repeats until the packet reaches its destination or the maximum TTL.
For more info, we recommend our guide on using HTTP tunnels to traceroute through a proxy with a firewall.
3. Limitations of Traceroute/Tracert
3.1. ICMP Blocking and Firewalls
A common limitation of Traceroute is that certain routers or firewalls block ICMP (Internet Control Message Protocol) messages, which are crucial for the Traceroute process. If an intermediate router along the path is configured to block these messages, Traceroute won’t receive a response from that hop.
For example, when we run a Traceroute to a destination, we might get the following result in return:
$ traceroute 8.8.8.8
1  192.168.1.1 (gateway)  1.145 ms
2  *  *  *   Request timed out
3  10.0.0.1  24.134 ms
...
The second hop doesn’t respond because it blocks ICMP requests. This incomplete data can make network troubleshooting more difficult because we don’t know what happens at that hop.
To fix it, we can use some Traceroute versions that allow UDP or TCP packets instead of ICMP to bypass these restrictions:
$ traceroute -T 8.8.8.8
This sends TCP packets, which may bypass firewalls blocking ICMP.
3.2. Asymmetric Routing
In an ideal scenario, packets take the same path from the source to the destination as they do on the way back. However, modern networks often use asymmetric routing, meaning that the return path may differ from the forward path.
Let’s say we use Traceroute to a destination server, but unknown to us, the return path from the server follows a different route. In this case, Traceroute only shows us the path to the server, not back to us. This can lead to a false sense of where the problem lies, especially if the issue exists on the return path:
$ traceroute example.com
1  192.168.1.1  1.245 ms
2  10.0.0.1    10.123 ms
3  172.16.0.5  23.456 ms
Although we see a forward path, the return path might involve entirely different routers. Asymmetric routing is common in large networks, and Traceroute doesn’t account for this, making it difficult to diagnose issues that arise on the return leg.
To address this issue, we can use tools that can trace both paths (forward and reverse) or combine the Traceroute results from both the source and destination to cross-validate routes.
3.3. Load Balancing
Many networks employ load balancing, where traffic is distributed across multiple paths. When this happens, different packets in the same Traceroute run might take different routes, resulting in inconsistent or confusing output.
For example:
$ traceroute 8.8.8.8
1  192.168.1.1  1.245 ms
2  10.0.0.1    12.123 ms
2  10.0.0.2    13.789 ms
3  172.16.0.5  24.567 ms
The second hop alternates between two routers (10.0.0.1 and 10.0.0.2), indicating load balancing. The results can vary each time we run Traceroute, making it harder to pinpoint a specific issue.
3.4. Hidden Hops
Some ISPs or network providers hide their internal infrastructure, leading to “hidden hops.” These routers don’t appear in the Traceroute output, as they are configured to drop ICMP TTL-exceeded messages or not respond to Traceroute queries altogether:
$ traceroute example.com
1  192.168.1.1  1.345 ms
2  * * *        Request timed out
3  172.16.0.5   25.789 ms
In this example, the second router is intentionally hidden, i.e., invisible in the Traceroute output. This can lead to confusion when diagnosing network problems, as we don’t know whether the hop is congested, misconfigured, or hidden.
3.5. Rate Limiting and Timeouts
Routers along the path might implement rate limiting for ICMP messages, leading to delayed or missed responses.
When routers prioritize routing actual traffic over responding to Traceroute requests, it can lead to incomplete or inaccurate Traceroute outputs:
$ traceroute example.com
1  192.168.1.1  1.145 ms
2  10.0.0.1    25.789 ms
3  * * *        Request timed out
4  172.16.0.5  48.123 ms
Here, the third router might be rate-limiting ICMP messages, causing Traceroute to miss its response even though the router works correctly for normal traffic.
3.6. Limited Insight into Network Problems
Traceroute can’t always distinguish between a problem with a router and an issue with the path beyond it.
For example, a high-latency hop in Traceroute might not necessarily indicate a problem at that hop as the issue can lie beyond it:
$ traceroute example.com
1  192.168.1.1  1.145 ms
2  10.0.0.1    12.789 ms
3  172.16.0.5  200.123 ms
4  172.16.0.6  23.567 ms
Here, the latency spike at the third hop could be misleading. It might not indicate an issue at that hop, as the router could be prioritizing actual traffic over Traceroute responses. The real problem could be further along the path.
4. Overcoming Traceroute Limitations
While Traceroute is useful, some alternatives offer different approaches to network diagnostics:
4.1. MTR (My Traceroute)
MTR combines the functionalities of both Traceroute and ping, offering a continuous and real-time view of the path between your machine and the destination. It tracks each hop’s latency and packet loss over time, making it easier to spot intermittent network issues.
On Linux, we can install MTR using the package manager:
sudo apt-get install mtr    # For Ubuntu/Debian
sudo yum install mtr        # For CentOS/RHEL
On MacOS, we can use Homebrew:
brew install mtr
Finally, we can download the executable file for Windows, avoiding installation.
MTR shows real-time updates of packet loss, latency, and the performance of each hop along the route:
mtr 8.8.8.8

 HOST: localmachine                   Loss%   Snt   Last   Avg  Best  Wrst StDev
  1. 192.168.0.1                      0.0%    10    1.3    1.2   1.0   2.0   0.3
  2. 10.10.10.1                       0.0%    10    2.6    2.8   2.3   3.5   0.4
  3. 172.16.1.254                     0.0%    10    9.5    8.9   8.1  10.3   0.8
  4. 203.0.113.1                      0.0%    10   15.6   15.1  14.2  17.3   1.0
  5. 198.51.100.1                     0.0%    10   24.1   23.5  22.0  25.8   1.4
  6. 198.51.100.2                     0.0%    10   30.2   31.0  29.9  33.6   1.3
  7. 8.8.8.8                          0.0%    10   35.6   35.2  34.0  36.5   0.7
Let’s explain all the fields in the output:
- Loss%: The percentage of packets lost at each hop. A high loss percentage at a particular hop may indicate network congestion or router issues
- Snt: The number of packets sent to each hop
- Last: The time (in milliseconds) it took for the most recent packet to travel to the hop and back
- Avg: The average round-trip time for packets to the hop
- Best: The shortest round-trip time for packets to the hop
- Wrst: The longest round-trip time for packets to the hop
- StDev: The standard deviation of round-trip times, showing us how much the response times vary
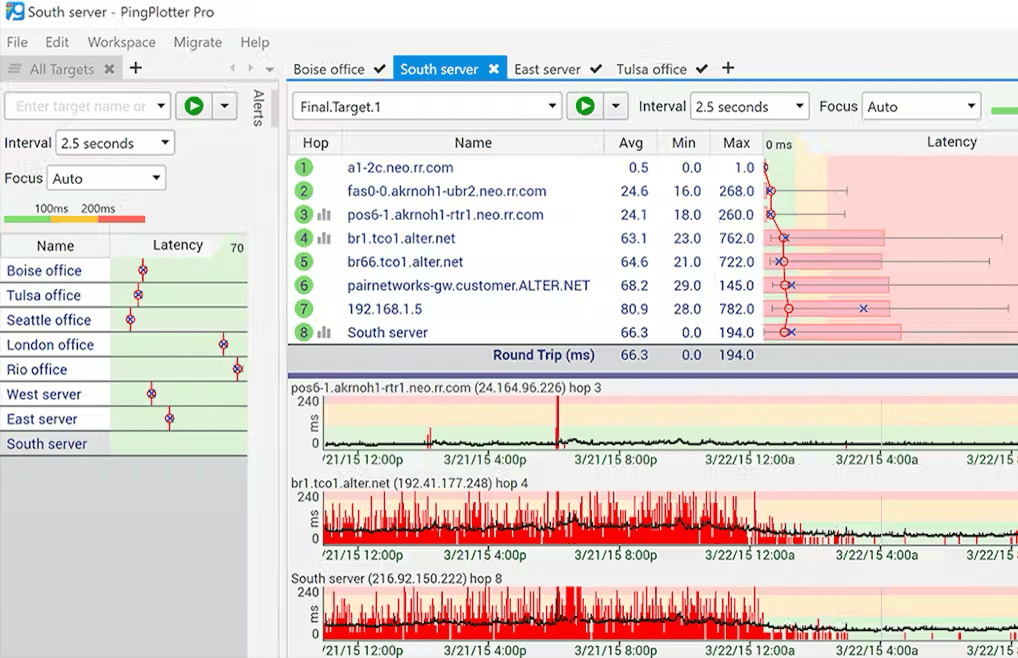
4.2. PingPlotter
PingPlotter is a graphical tool that provides a visual timeline of the network path, making it easier to understand network performance over time. It continuously pings each hop and shows latency, jitter, and packet loss in a graphical format, allowing us to spot patterns or anomalies easily:
4.3. Combining Tools for Comprehensive Diagnostics
A combination of tools like MTR, Ping, and Traceroute can provide us with a more complete understanding of network performance. For example:
# Step 1: Use Traceroute to identify the hops
traceroute example.com

# Step 2: Use MTR for real-time, continuous performance
mtr example.com

# Step 3: Use Ping to focus on a specific hop's packet loss and latency
ping 192.168.1.1
Combining these tools reduces the risk of missing issues caused by firewalls, ICMP blocking, or load-balancing routers. Each tool provides unique insights into network performance, which can help triangulate the root cause of any issues.
5. Conclusion
In this article, we explored the limitations of Traceroute and Tracert, highlighting their common pitfalls in network diagnostics. While these tools are valuable for tracing the path of packets across a network, they have several weaknesses, including inconsistent results from firewalls, asymmetric routing, and devices that may filter or ignore specific requests. We also discussed alternative tools like MTR that offer more granular, real-time monitoring to overcome some of these limitations.
Understanding the limitations and combining tools like Traceroute and MTR can help us perform more accurate and reliable network troubleshooting. However, network diagnostics will always involve interpreting incomplete data and understanding each network’s specific configurations.