1. 概述
Java 应用开发中,内存问题常导致性能瓶颈。内存问题可分两类:
- 堆内存问题
- 非堆内存问题
本文聚焦非堆内存监控,介绍多种实用工具及使用场景。
2. 使用 jcmd
jcmd 是 JDK 内置诊断工具,可向运行中的 Java 进程发送诊断命令。常用于:
- 查看系统属性
- 触发 GC
- 导出堆/线程信息
- 管理 JIT 编译
监控非堆内存需先启用 本地内存跟踪(NMT),再通过 jcmd 获取:
jcmd <pid> VM.native_memory
输出包含所有非堆内存区域详情:
-                        GC (reserved=359872KB, committed=70440KB)
                            (malloc=17792KB #582)
                            (mmap: reserved=342080KB, committed=52648KB)

-                  Compiler (reserved=168KB, committed=168KB)
                            (malloc=4KB #29)
                            (arena=165KB #5)

-                  Internal (reserved=221KB, committed=221KB)
                            (malloc=157KB #1202)
                            (mmap: reserved=64KB, committed=64KB)

-                     Other (reserved=4KB, committed=4KB)
                            (malloc=4KB #2)

-                    Symbol (reserved=1217KB, committed=1217KB)
                            (malloc=857KB #3546)
                            (arena=360KB #1)

-    Native Memory Tracking (reserved=141KB, committed=141KB)
                            (malloc=5KB #69)
                            (tracking overhead=136KB)

//shorten
✅ committed 值表示当前实际占用内存
⚠️ NMT 会带来约 5-10% 性能开销,生产环境慎用
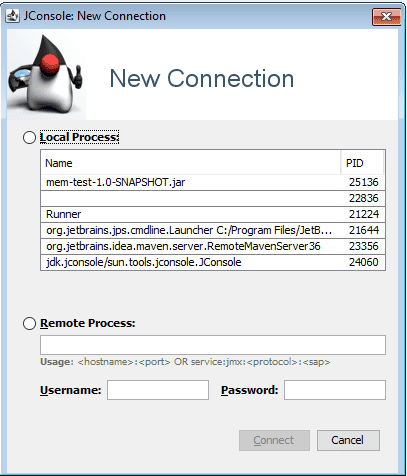
3. 使用 jconsole
jconsole 是符合 JMX 规范的可视化监控工具。通过图形界面实时监控:
- 内存使用
- 线程活动
- CPU 消耗
- MBeans
启动命令(在 JDK bin 目录):
<JDK_PATH>\bin\jconsole
操作步骤:
- 选择本地/远程进程
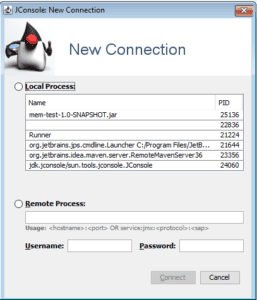
- 切换到
Memory标签页 - 选择
Non-Heap Memory Usage图表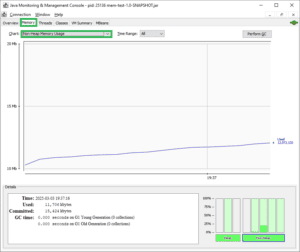
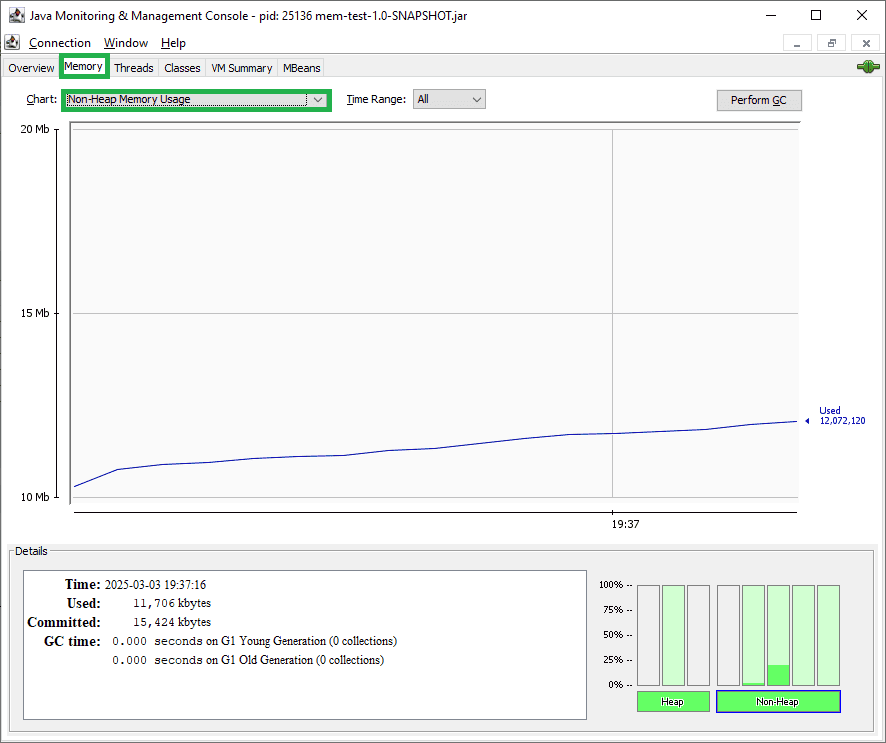
❌ 不支持监控 Direct Buffer 内存
✅ 适合快速排查本地进程
4. VisualVM
VisualVM 是功能更强大的可视化工具,支持:
- CPU 负载监控
- 内存分析
- 线程活动跟踪
- 堆转储分析
- 方法执行性能分析
4.1. 基础监控中的 MetaSpace
默认安装即可在 Monitor 标签页查看 MetaSpace: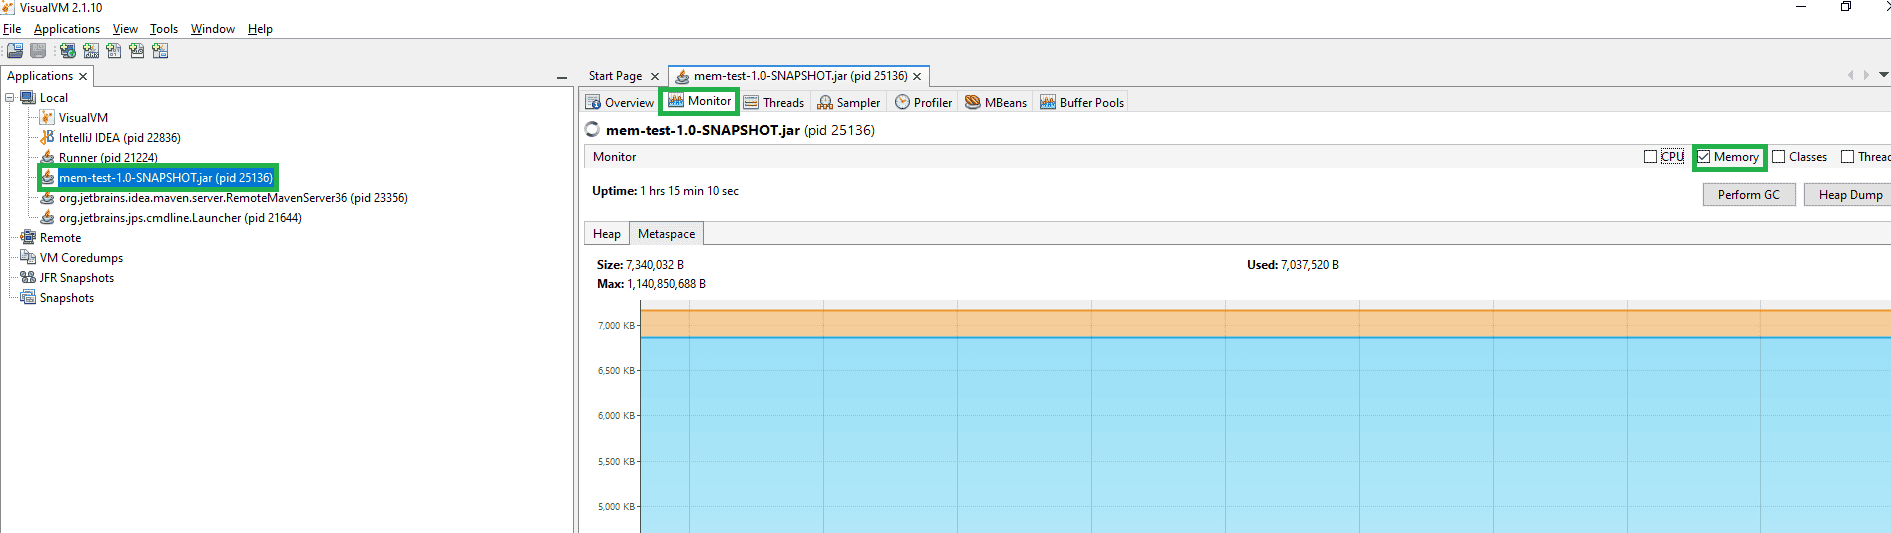
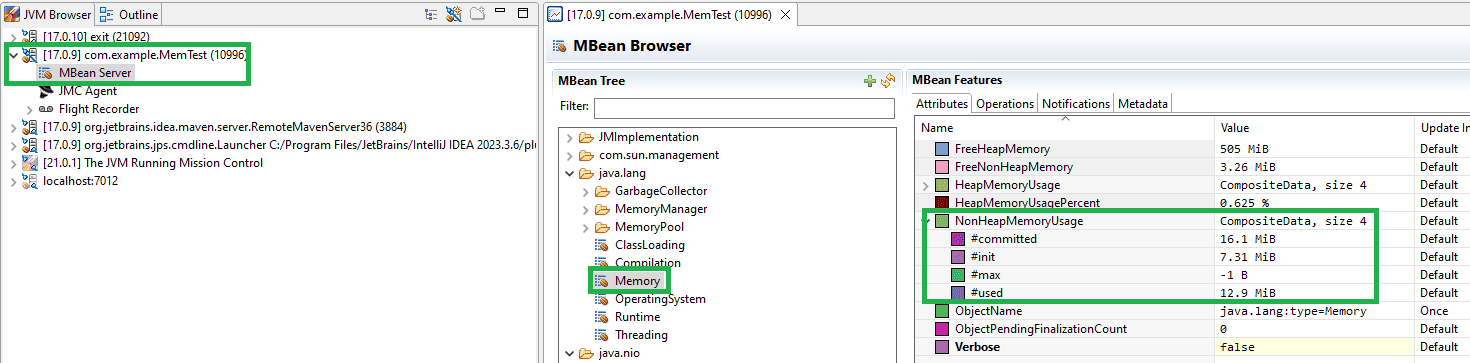
4.2. 使用 MBeans 插件监控非堆内存
安装 MBeans 插件 后:
- 新增
MBeans标签页 - 查看
java.lang/Memory节点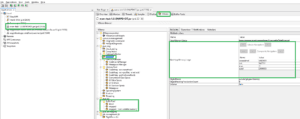

✅ 可查看各内存区域细分数据
4.3. 使用 Buffer Pools 插件监控 Direct Buffer
安装 Buffer Monitor 插件 后:
- 新增
Buffer Pools标签页 - 查看:
- Direct Buffer 内存
- 内存映射文件占用
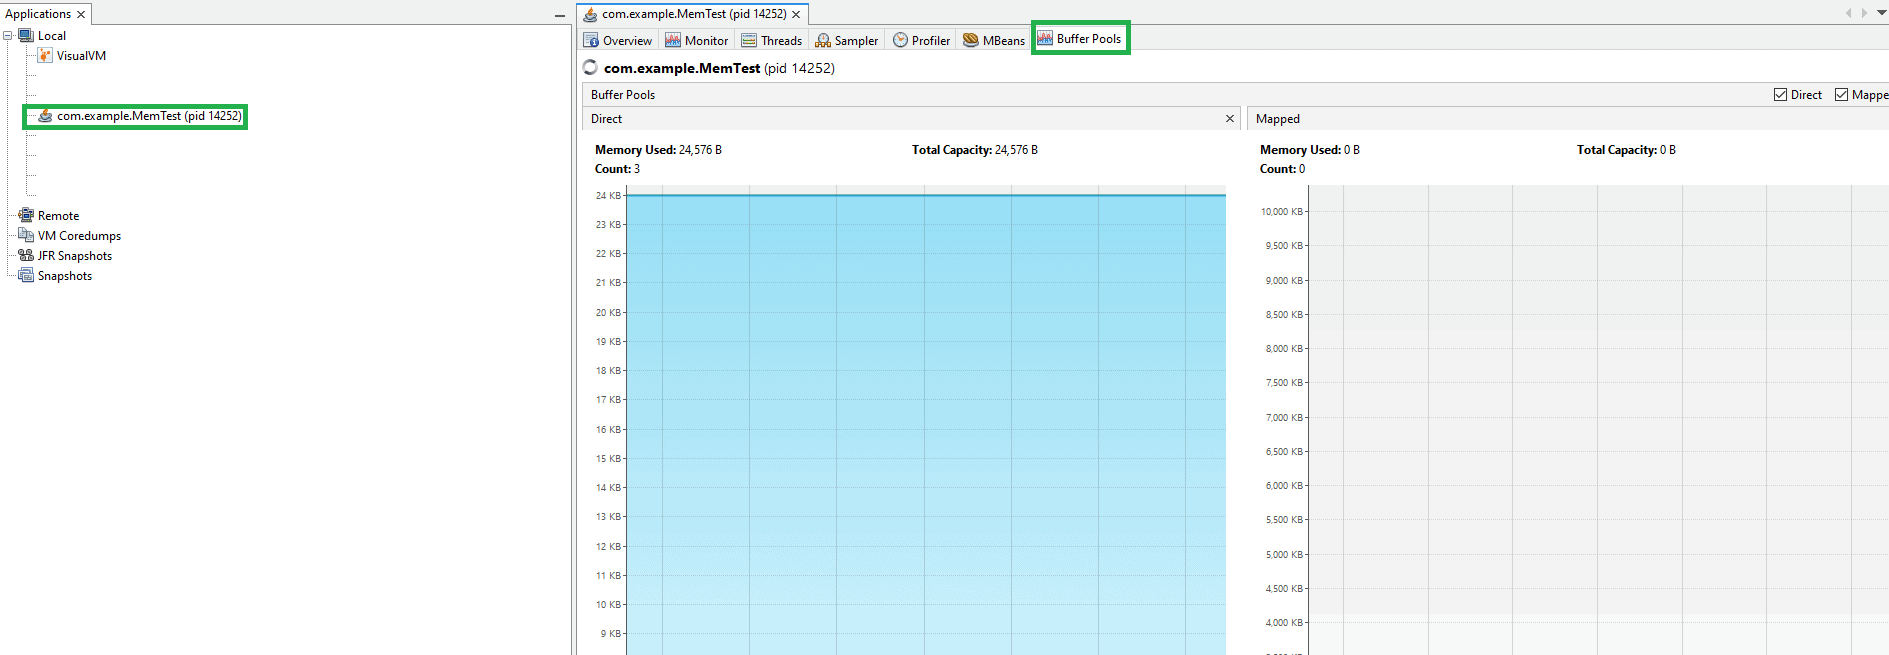
⚠️ 需手动安装插件,但功能更全面
5. Java Mission Control
JMC 是专业级诊断工具,核心能力:
- 性能分析
- 内存监控
- 线程活动检查
- GC 行为分析
- 飞行记录(JFR)分析
5.1. 通过 MBean 浏览器监控
连接后操作:
- 打开
MBean Server标签页 - 查看总非堆内存占用
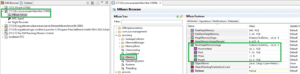
- 在
BufferPool组查看 Direct Buffer 内存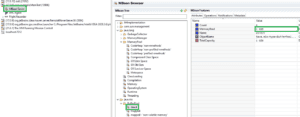
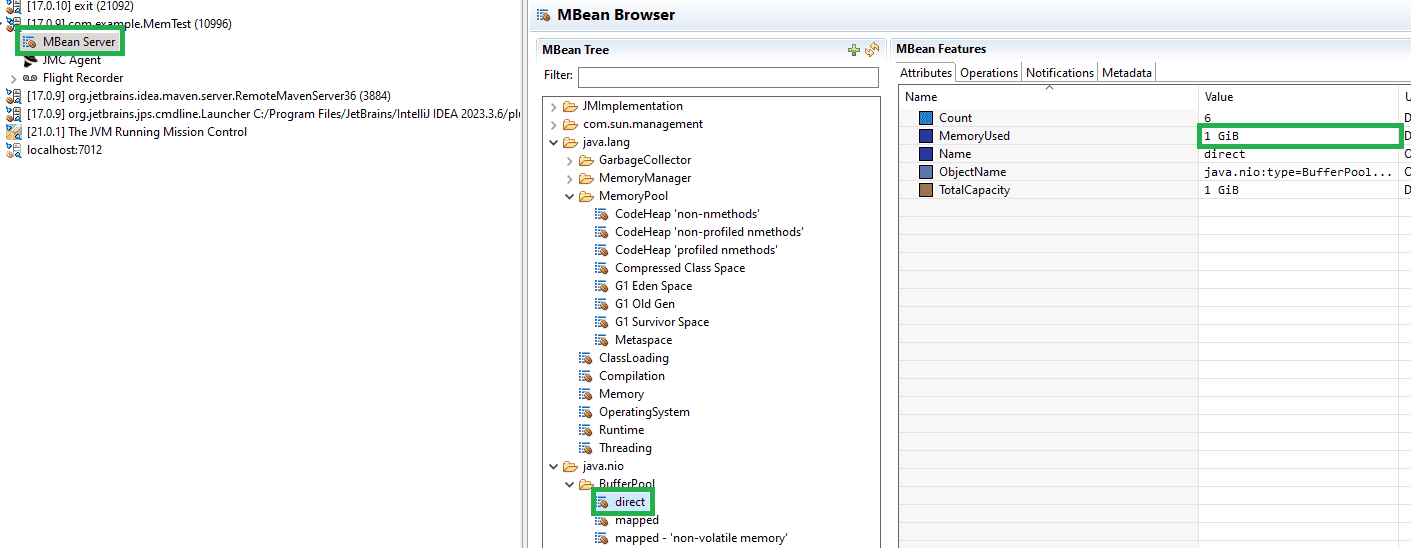
❌ 默认不包含 Direct Buffer 内存
5.2. 使用 JFR 记录 NMT 数据
Java 20+ 支持 JFR 持续记录 NMT 数据:
java -XX:NativeMemoryTracking=detail \
     -XX:StartFlightRecording=name=Profiling,filename=nmt-recording.jfr,settings=profile \
     -jar path/ourapp.jar
在 JMC 中分析:
- 打开
nmt-recording.jfr - 进入
Event Browser标签页 - 查找
Total Native Memory Usage事件(含堆+非堆总内存)
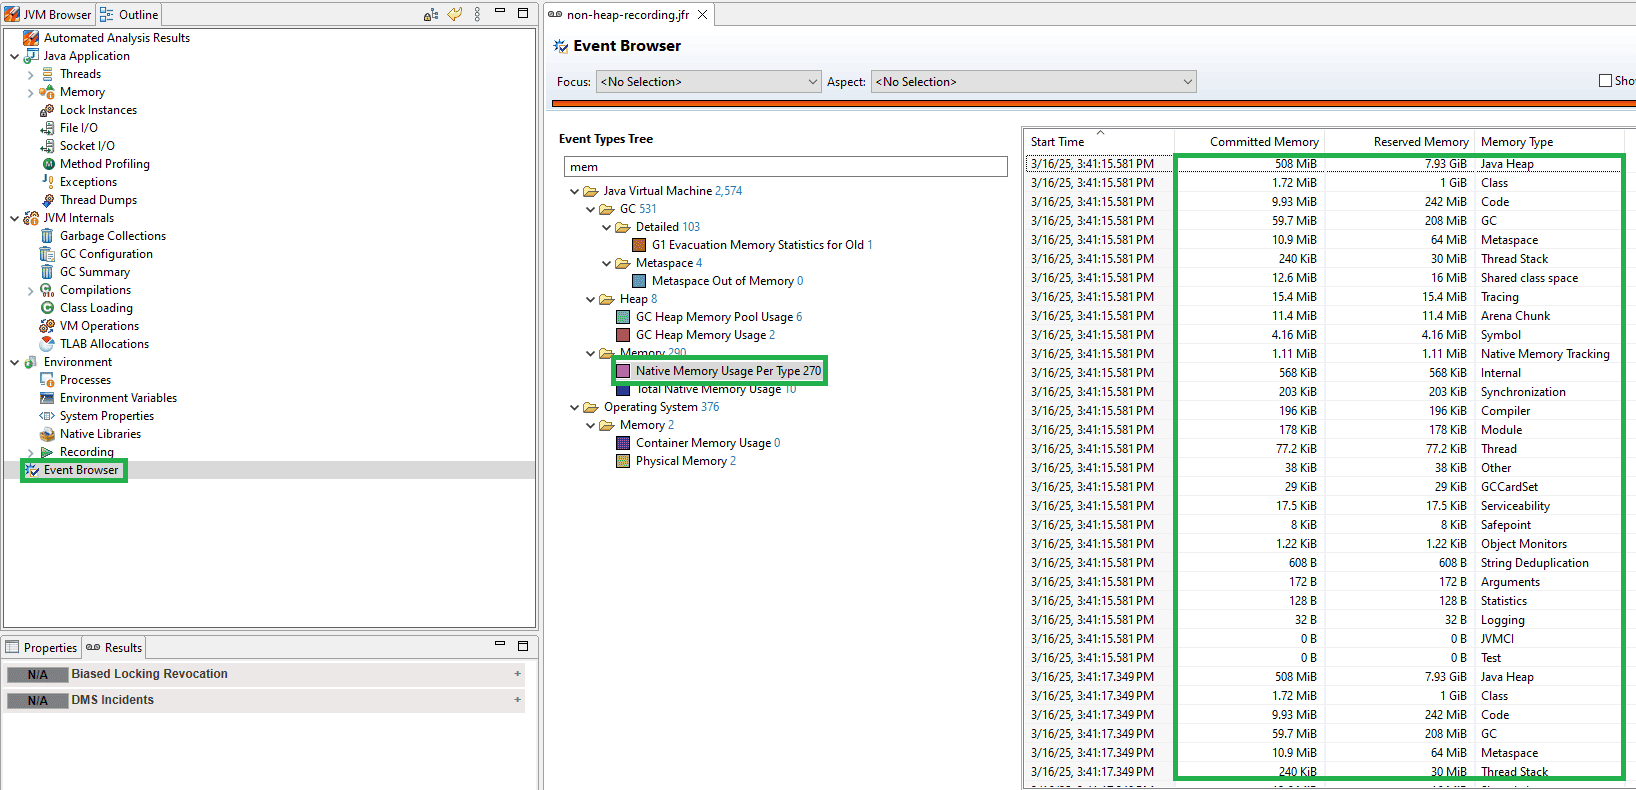
- 查找
Native Memory Usage Per Type事件(非堆内存细分)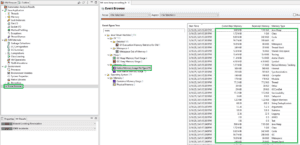
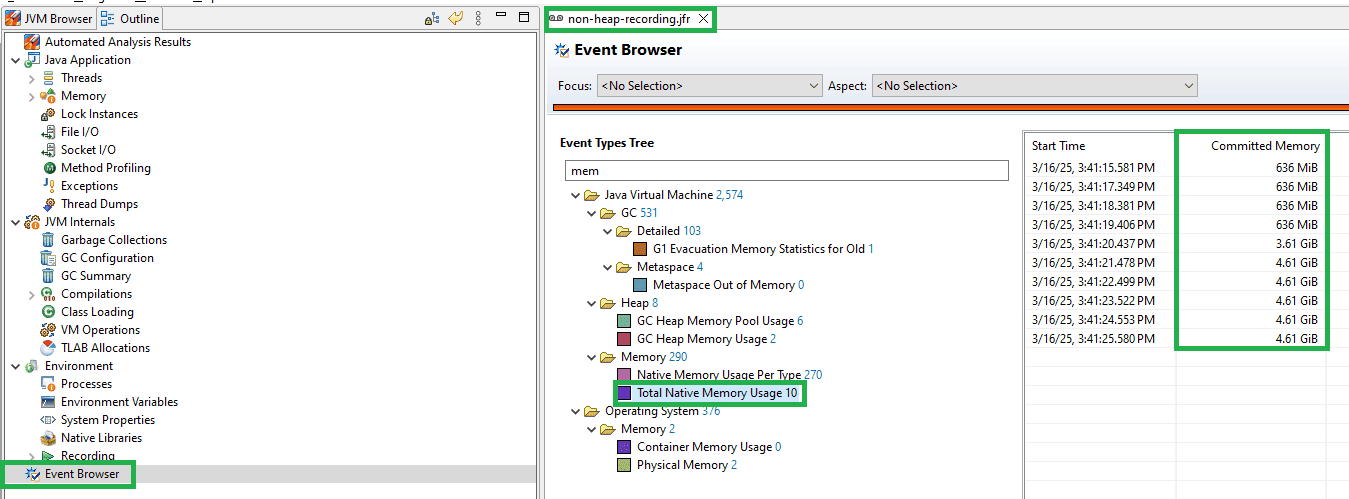
✅ 生产环境推荐方案,性能开销低
6. JMX-DExporter
JMX-DExporter 将 JMX 指标转换为 Prometheus 格式,可监控:
- 内存使用
- 线程状态
- GC 统计
- 自定义指标
6.1. 指标接口使用
操作步骤:
- 下载 agent JAR
- 创建配置文件
jmx_exporter_config.yml: ```yaml startDelaySeconds: 0 lowercaseOutputName: true lowercaseOutputLabelNames: true
rules:
- pattern: "java.lang:type=Memory" name: "jvm_memory_usage_bytes" labels: area: "$2" type: GAUGE ```
- 启动应用时挂载 agent:
java -javaagent:.path-to-agent-jar\jmx_prometheus_javaagent.jar=port:path-to-agent-jar\jmx_exporter_config.yml \
  -jar .path-to-app\app.jar
访问 http://localhost:port/metrics 获取指标:
//shorten
jvm_memory_committed_bytes{area="nonheap"} 1.8546688E7
# HELP jvm_memory_init_bytes Initial bytes of a given JVM memory area.
# TYPE jvm_memory_init_bytes gauge
jvm_memory_init_bytes{area="heap"} 5.32676608E8
jvm_memory_init_bytes{area="nonheap"} 7667712.0
# HELP jvm_memory_max_bytes Max (bytes) of a given JVM memory area.
# TYPE jvm_memory_max_bytes gauge
jvm_memory_max_bytes{area="heap"} 8.518631424E9
jvm_memory_max_bytes{area="nonheap"} -1.0
//shorten
6.2. 集成 Prometheus
Prometheus 是开源监控告警系统,集成步骤:
- 修改
prometheus.yml: ```yaml scrape_configs:
- job_name: "our_app"
static_configs:
- targets: ["localhost:port"] ```
- 重启 Prometheus
- 在控制台查询指标(如
jvm_memory_committed_bytes{area="nonheap"})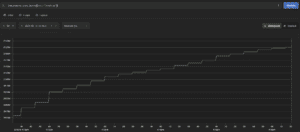
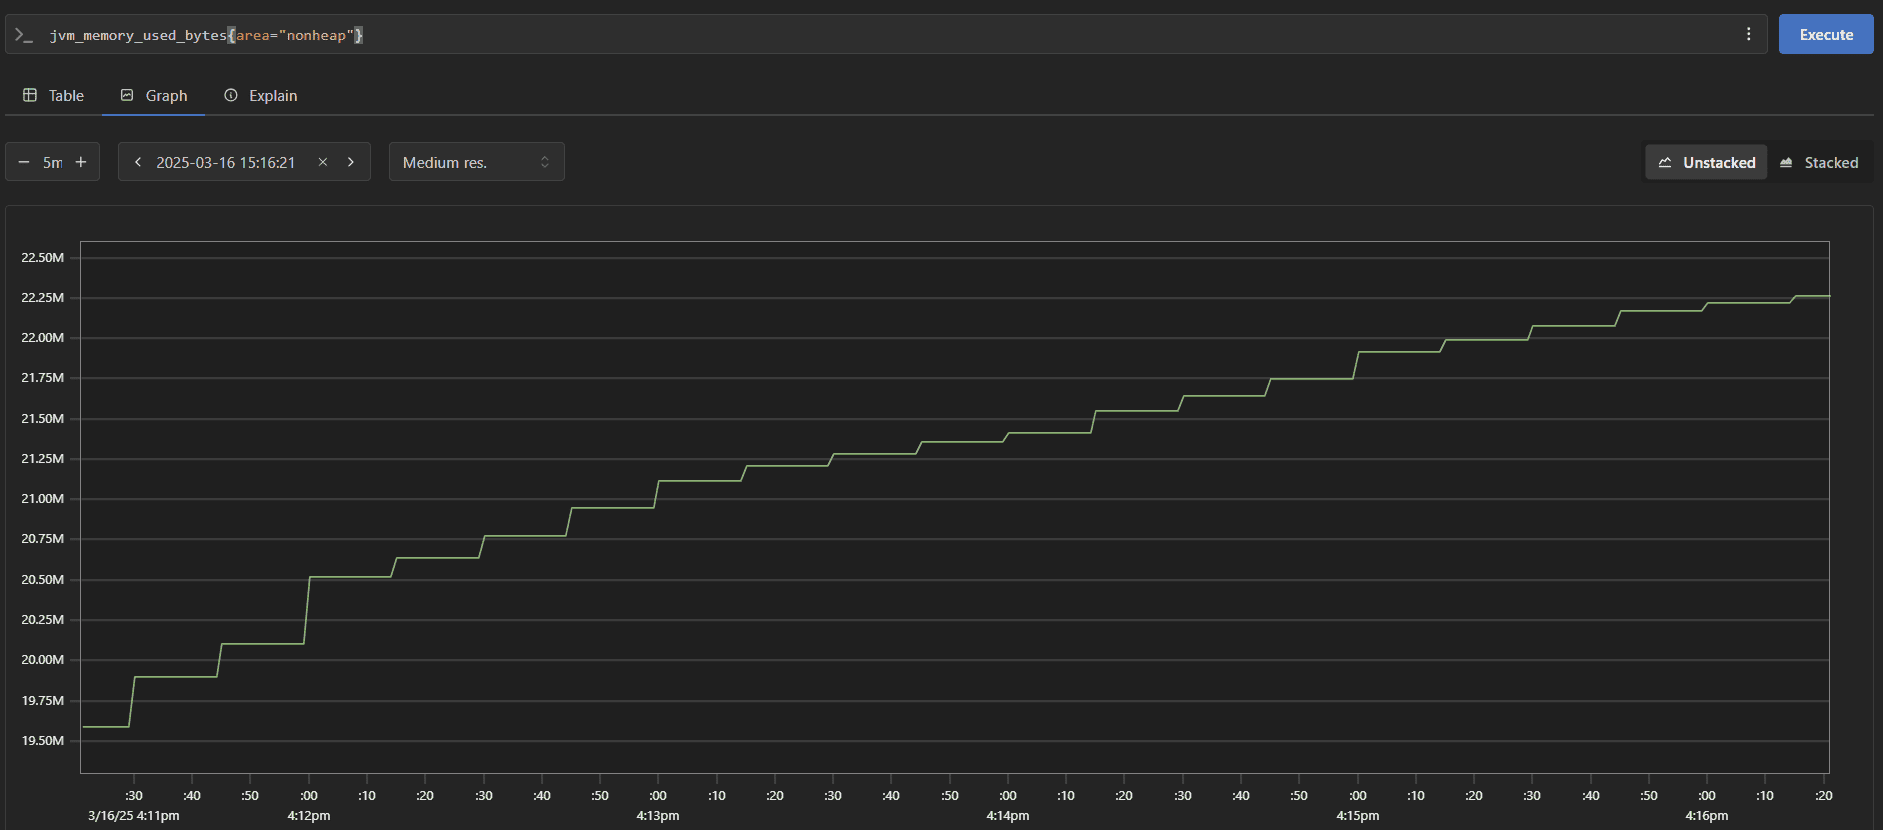
✅ 适合云原生环境下的持续监控
7. 总结
根据场景选择工具:
| 场景 | 推荐工具 | 特点 |
|---|---|---|
| 快速本地排查 | jcmd/jconsole | 无需安装,基础功能 |
| 详细内存分析 | VisualVM | 插件扩展性强 |
| 生产环境监控 | JMC+JFR | 低开销,专业分析 |
| 云原生监控 | JMX-Exporter+Prometheus | 集成告警系统 |
⚠️ 所有监控工具都会产生额外资源开销,生产环境需评估影响。对于非堆内存问题,建议优先使用 JFR+JMC 组合,兼顾细节分析和性能影响。