1. 概述
New Relic的应用性能监控(APM)工具能帮我们在统一平台中监控和分析应用程序及微服务的性能。它消除了为不同系统组件使用独立工具的麻烦,让性能管理更简单高效。
New Relic Java 代理会持续监控应用性能问题和错误,定期将指标和事件数据发送到 New Relic 控制台,方便我们审查和优化应用性能。
本教程将探讨 New Relic Java 代理的几个核心功能,包括请求追踪、自定义监控和告警配置,这些功能能显著提升我们应用的观测和优化能力。
2. 环境搭建
我们将通过一个CurrencyConverterService示例展示 New Relic Java 代理的功能,该服务调用汇率 API 并将结果缓存到 Redis。首先需要设置 New Relic 账户。
在注册页面,可以使用公司邮箱或第三方授权提供商登录。注册后,我们安装 Java 代理。New Relic 提供两种安装方式:UI 引导安装或手动安装。本示例采用手动安装。
使用 Apache Maven 下载包含所有Java 代理组件的newrelic-java.zip文件,在 POM 文件中添加依赖:
<dependency>
    <groupId>com.newrelic.agent.java</groupId>
    <artifactId>newrelic-java</artifactId>
    <version>8.17.0</version>
    <scope>provided</scope>
    <type>zip</type>
</dependency>
接着配置 Maven 插件,将 Java 代理解压到 target 目录:
<plugin>
    <groupId>org.apache.maven.plugins</groupId>
    <artifactId>maven-dependency-plugin</artifactId>
    <version>3.1.1</version>
    <executions>
        <execution>
            <id>unpack-newrelic</id>
            <phase>package</phase>
            <goals>
                <goal>unpack-dependencies</goal>
            </goals>
            <configuration>
                <includeGroupIds>com.newrelic.agent.java</includeGroupIds>
                <includeArtifactIds>newrelic-java</includeArtifactIds>
                <excludes>**/newrelic.yml</excludes>
                <overWriteReleases>false</overWriteReleases>
                <overWriteSnapshots>false</overWriteSnapshots>
                <overWriteIfNewer>true</overWriteIfNewer>
                <outputDirectory>${project.build.directory}</outputDirectory>
            </configuration>
        </execution>
    </executions>
</plugin>
该插件会将代理组件解压到项目根目录的newrelic文件夹。我们特意排除newrelic.yml文件,防止每次 Maven 重新解压时覆盖配置。
接下来配置newrelic.yml文件,下载模板文件并编辑:
curl -L -o /path/to/extracted/agent/newrelic/newrelic.yml https://download.newrelic.com/newrelic/java-agent/newrelic-agent/8.17.0/newrelic.yml
按最佳实践修改文件权限(Linux 系统):
chmod 600 newrelic.yml
编辑配置值:
common: &default_settings
  license_key: 1234567890abcdef  # 替换为真实许可证密钥
  agent_enabled: true
  app_name: Currency Converter
  #...

development:
  <<: *default_settings
  app_name: Currency Converter (Development)

test:
  <<: *default_settings
  app_name: Currency Converter (Test)

production:
  <<: *default_settings

staging:
  <<: *default_settings
  app_name: Currency Converter (Staging)
license_key在创建 New Relic 账户时获取。启动应用测试配置:
java -javaagent:/path/to/newrelic.jar -jar /path/to/currency-converter-0.0.1.jar
稍等片刻,即可在*one.newrelic.com -> APM & Services*中看到服务列表。
3. 请求追踪
与其他 APM 工具类似,New Relic 能可视化追踪请求路径。向服务发送请求测试此功能:
curl --request GET \
  --url 'http://localhost:8080/api/currency/convert?targetCurrency=GBP&amount=100'
进入 New Relic 控制台 -> Traces,选择追踪记录,会看到类似下图的流程:
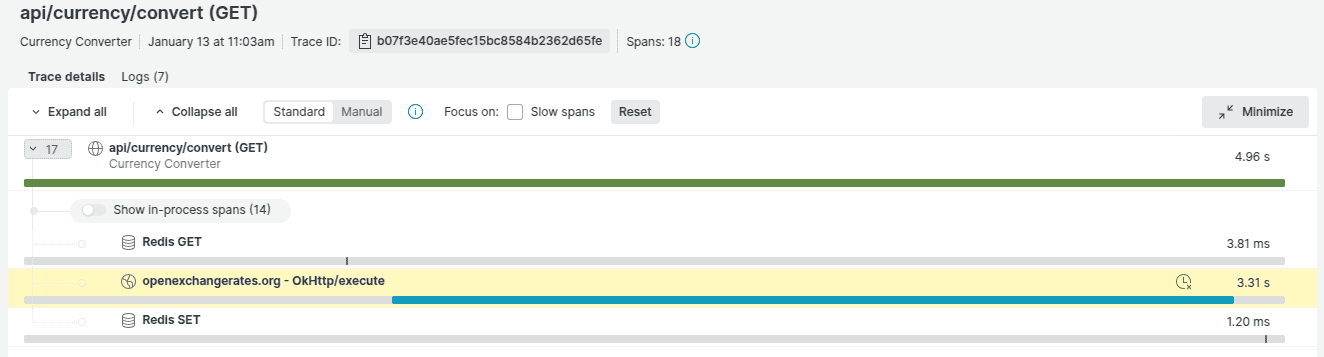
该请求经历了:查询 Redis 缓存 -> 缓存未命中 -> 调用汇率 API -> 将结果存入 Redis 缓存。
4. 实现自定义监控
虽然 Java 代理能自动生成性能数据,但通过Java 代理 API可以进一步丰富事务追踪细节。添加依赖:
<dependency>
    <groupId>com.newrelic.agent.java</groupId>
    <artifactId>newrelic-api</artifactId>
    <version>8.17.0</version>
    <scope>runtime</scope>
</dependency>
更新服务代码使用代理 API:
@Service
public class CurrencyConverterService {
    //...
    @Value("${openexchangerates.base_currency}")
    public String baseCurrency;

    @Trace(metricName="CurrencyConversionCalc")
    public double getConvertedAmount(String targetCurrency, double amount) {
        String cacheKey = baseCurrency + "-" + targetCurrency;
        //...
        String eTagHeaderField = response.header("ETag");
        NewRelic.addCustomParameter(cacheKey, eTagHeaderField);
        //...
    }
}
@Trace注解指示代理监控*getConvertedAmount()*方法,metricName属性为指标指定名称。我们手动捕获汇率 API 返回的 ETag 头信息作为自定义参数。
在newrelic.yml中启用自定义追踪:
common: &default_settings
  #...
  enable_custom_tracing: true
重启应用后,会看到新增的监控信息:
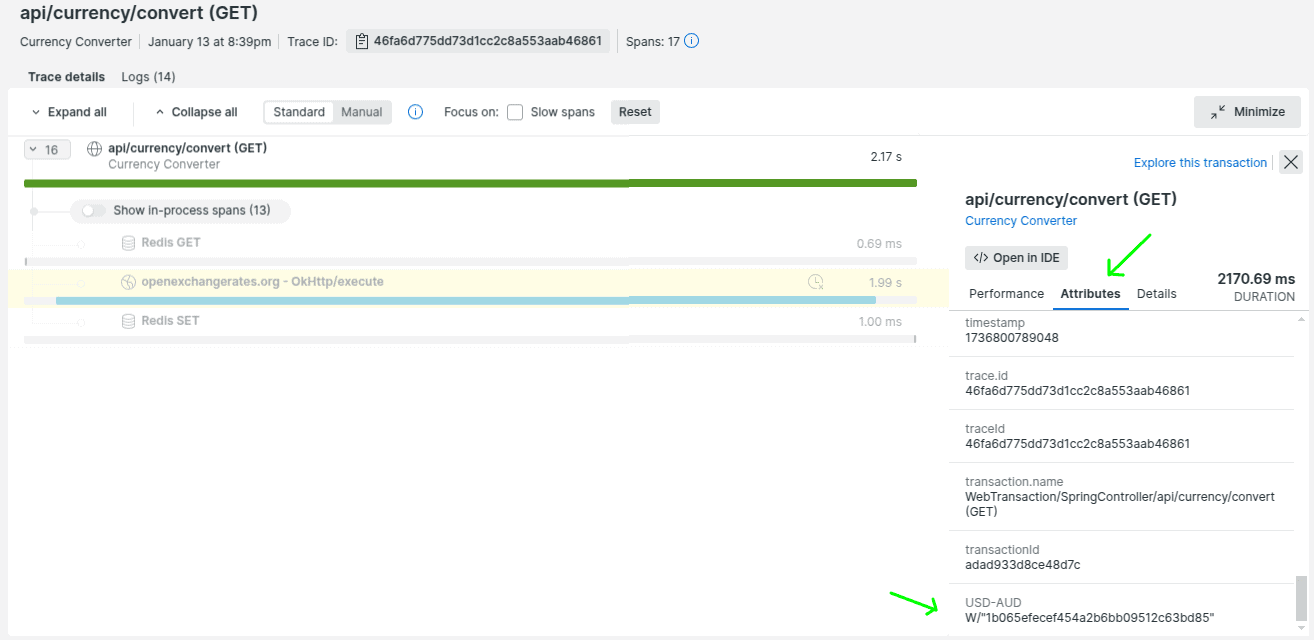
自定义属性常用于执行特定数据查询。示例查询语句:
SELECT count(`USD-AUD`) FROM `Transaction` SINCE 24 hours ago UNTIL now TIMESERIES
查询结果示例:
[
    {
        "metadata": {
            "timeSeries": {
                "messages": [],
                "contents": [
                    {
                        "function": "count",
                        "attribute": "USD-AUD",
                        "simple": true
                    }
                ]
            },
            "eventTypes": [
                "Transaction"
            ],
            "eventType": "Transaction",
            "messages": [],
            "rawSince": "24 HOURS AGO",
            "rawUntil": "NOW",
            "rawCompareWith": ""
        },
        "total": {
            "results": [
                {
                    "count": 1
                }
            ],
            "beginTimeSeconds": 1736759267,
            "endTimeSeconds": 1736845667
        }
    }
]
从时间序列可见,服务在查询的 24 小时内仅被调用一次。
5. 配置告警
New Relic 的告警功能让我们能配置预警通知,及时发现应用性能或活动中的问题或异常。在控制台使用各种指标配置告警。先创建自定义指标:
//...
Double cachedRate = redisTemplate.opsForValue().get(cacheKey);
if (cachedRate != null) {
    logger.info("Cache hit for key: {}", cacheKey);
    return amount * cachedRate;
} else {
    logger.info("Cache miss for key: {}, fetching from API", cacheKey);
    NewRelic.incrementCounter("Custom/CacheMisses");
}
//...
每次缓存未命中时,我们增加关联的metricTimesliceName计数器。接下来配置监控此指标的告警条件。
进入 New Relic 控制台 -> Alerts -> Alert Conditions,选择'New alert condition'。使用引导模式创建条件,我们的metricTimesliceName会在代理收集数据后出现在Services – APM -> ENTITY_NAME -> Other Metrics下:
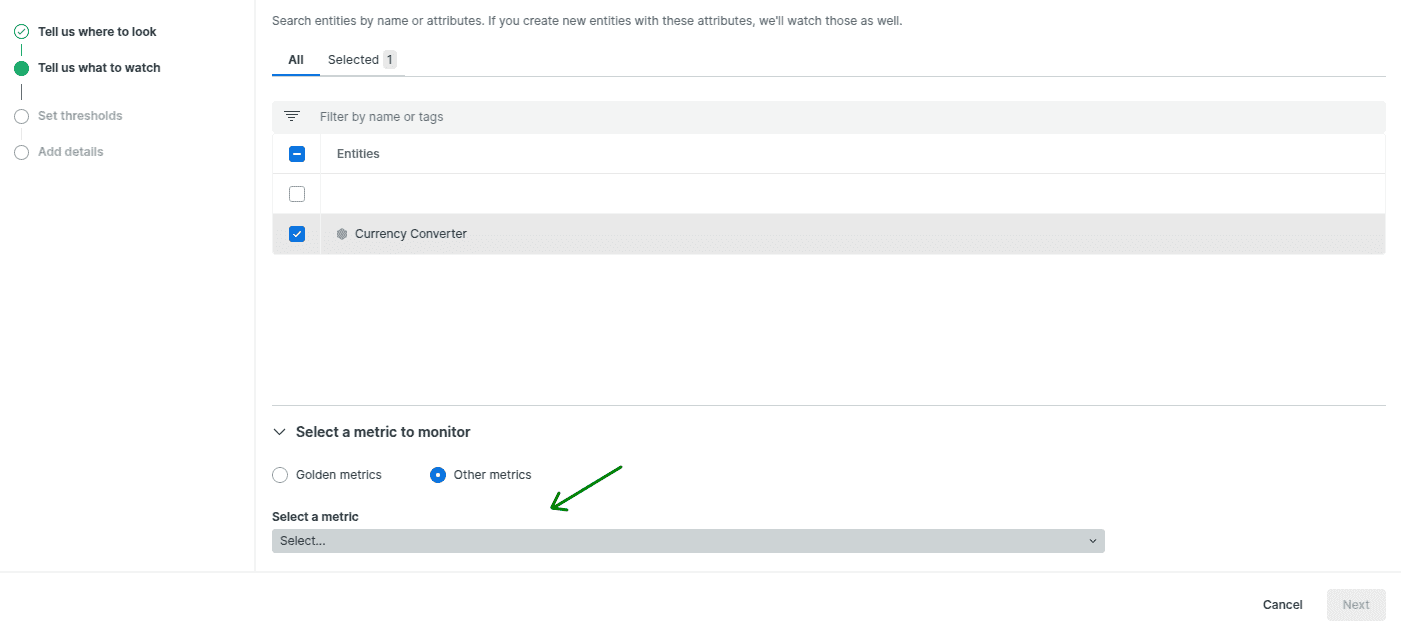
通过引导模式创建告警策略,将告警条件分组并关联到自定义通知的工作流。触发条件后,告警策略会激活告警及关联工作流:

6. 总结
本文探讨了 New Relic Java 代理的核心功能及其对应用观测能力的增强:
- ✅ 请求追踪:可视化系统请求路径
- ✅ 自定义监控:通过 API 丰富遥测数据
- ✅ 告警配置:设置性能异常预警机制
这些功能组合使用,能显著提升复杂应用的性能监控和问题定位效率。