1. 概述
项目构建过程中通常会运行大量自动化测试,包括单元测试和集成测试。✅
当测试套件执行耗时过长时,我们往往需要优化测试代码,或定位执行缓慢的测试用例。这在持续集成(CI)环境中尤为关键,慢测试会拖慢交付速度。
本文将介绍几种实用方法,帮助你准确获取 JUnit 测试的执行耗时,便于性能分析和优化。
2. JUnit 示例代码
为了演示执行时间的统计,我们准备了三类典型测试场景,模拟测试金字塔中不同层级的耗时行为。通过 Thread.sleep() 模拟执行延迟。
我们基于 JUnit 5 实现示例,但相关方法同样适用于 JUnit 4。
2.1 简单单元测试
执行迅速,几乎无外部依赖:
@Test
void someUnitTest() {
    assertTrue(doSomething());
}
2.2 集成测试
模拟涉及外部资源(如数据库、网络)的场景,执行时间较长:
@Test
void someIntegrationTest() throws Exception {
    Thread.sleep(5000);
    assertTrue(doSomething());
}
2.3 端到端测试
模拟完整用户流程,通常最耗时:
@Test
void someEndToEndTest() throws Exception {
    Thread.sleep(10000);
    assertTrue(doSomething());
}
后续我们将通过不同工具执行这些测试,并查看其耗时详情。
3. 使用 IDE 的 JUnit Runner
最直接的方式就是利用 IDE 内置的 JUnit 运行器。主流 IDE 均提供图形化测试结果展示,包含执行时间。
3.1 IntelliJ IDEA
IntelliJ 提供强大的测试支持,通过运行/调试配置即可执行测试。执行后,测试面板会清晰展示每个用例的执行状态和耗时。
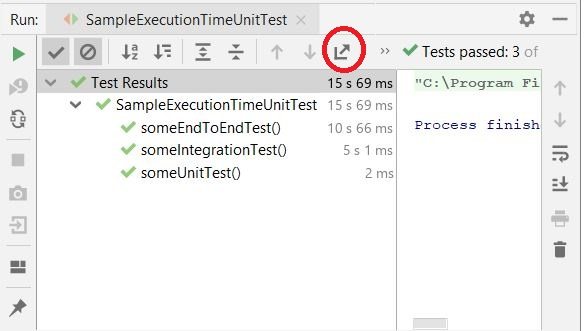
如图所示,你可以看到:
- ✅ 单个测试用例的执行时间
- ✅ 整个测试类的总耗时
⚠️ 更实用的是,IntelliJ 支持将测试报告导出为 HTML 或 XML 格式,方便归档或分享。导出按钮在工具栏中高亮显示。
3.2 Eclipse
Eclipse 同样内置 JUnit 运行器,测试结果窗口会显示执行时间和状态:
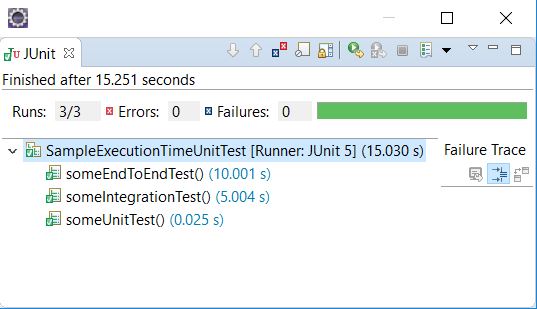
不过有个坑 ❌:Eclipse 不支持直接导出测试报告,无法生成结构化文件用于后续分析,灵活性不如 IntelliJ。
4. Maven Surefire 插件
Maven 的 maven-surefire-plugin 是构建过程中执行测试的核心组件。它默认集成在 Maven 生命周期中,但也支持自定义配置。
<plugin>
    <groupId>org.apache.maven.plugins</groupId>
    <artifactId>maven-surefire-plugin</artifactId>
    <version>3.0.0-M3</version>
    <configuration>
        <excludes>
            <exclude>**/*IntegrationTest.java</exclude>
        </excludes>
    </configuration>
    <dependencies>
        <dependency>
            <groupId>org.junit.platform</groupId>
            <artifactId>junit-platform-surefire-provider</artifactId>
            <version>1.3.2</version>
        </dependency>
    </dependencies>
</plugin>
使用 Maven 时,有三种方式获取测试耗时。
4.1 构建日志(Build Logs)
Surefire 会在控制台输出中打印每个测试类的执行摘要:
[INFO] Running com.baeldung.execution.time.SampleExecutionTimeUnitTest
[INFO] Tests run: 3, Failures: 0, Errors: 0, Skipped: 0, Time elapsed: 15.003 s
- in com.baeldung.execution.time.SampleExecutionTimeUnitTest
这是最简单的查看方式,适合本地快速验证。
4.2 Surefire 测试报告(文本与 XML)
Surefire 会自动生成测试报告,存放于项目的 target/surefire-reports/ 目录下。
- 文本报告(.txt):人类可读,适合快速浏览
----------------------------------------------
Test set: com.baeldung.execution.time.SampleExecutionTimeUnitTest
----------------------------------------------
Tests run: 3, Failures: 0, Errors: 0, Skipped: 0, Time elapsed: 15.003 s
- in com.baeldung.execution.time.SampleExecutionTimeUnitTest
- XML 报告:结构化数据,便于机器解析和集成
<?xml version="1.0" encoding="UTF-8"?>
<testsuite
    xmlns:xsi="http://www.w3.org/2001/XMLSchema-instance"
    xsi:noNamespaceSchemaLocation=
          "https://maven.apache.org/surefire/maven-surefire-plugin/xsd/surefire-test-report.xsd"
    name="com.baeldung.execution.time.SampleExecutionTimeUnitTest"
    time="15.003" tests="3" errors="0" skipped="0" failures="0">
    <testcase name="someEndToEndTest"
        classname="com.baeldung.execution.time.SampleExecutionTimeUnitTest"
        time="9.996" />
    <testcase name="someIntegrationTest"
        classname="com.baeldung.execution.time.SampleExecutionTimeUnitTest"
        time="5.003" />
    <testcase name="someUnitTest"
        classname="com.baeldung.execution.time.SampleExecutionTimeUnitTest"
        time="0.002" />
</testsuite>
✅ XML 中每个 <testcase> 都包含 time 属性,精确到毫秒,是后续分析的关键数据源。
4.3 Surefire HTML 报告
想看更直观的报告?可以用 maven-surefire-report-plugin 生成 HTML 页面:
<reporting>
    <plugins>
        <plugin>
            <groupId>org.apache.maven.plugins</groupId>
            <artifactId>maven-surefire-report-plugin</artifactId>
            <version>3.0.0-M3</version>
        </plugin>
    </plugins>
</reporting>
执行以下命令生成报告:
mvn surefire-report:report    # 生成基础 HTML
mvn site                      # 添加样式,生成完整站点
生成的报告如下图所示:
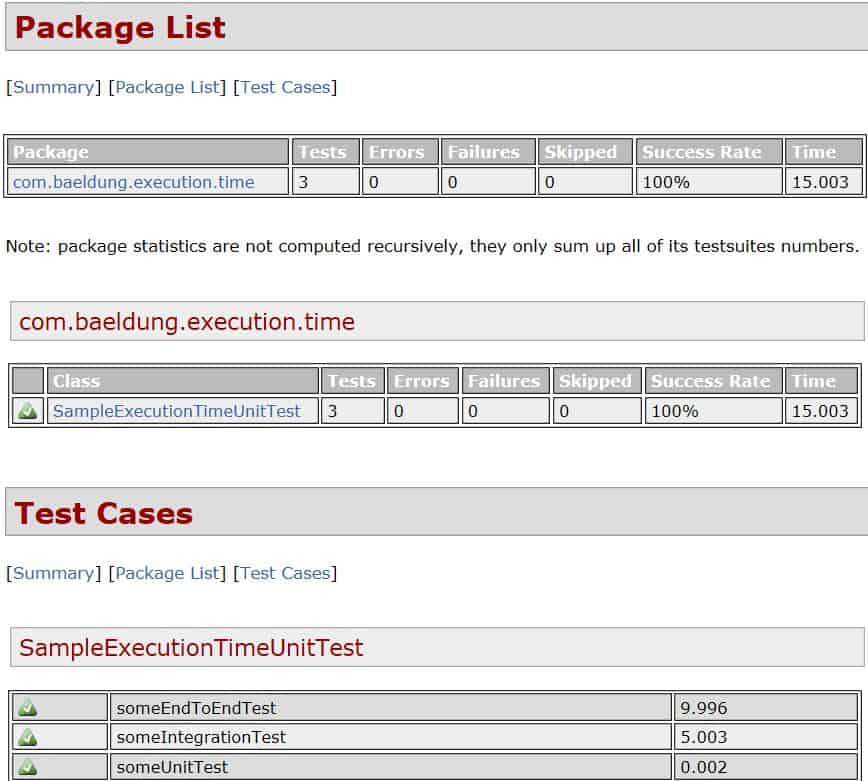
✅ 页面清晰列出每个测试类和用例的执行时间,适合团队共享或归档。
5. Jenkins 集成测试结果
在 CI/CD 流程中,Jenkins 可以消费 Surefire 生成的 XML 报告,实现测试结果可视化和趋势分析。
5.1 配置步骤
- 安装 Jenkins 并创建 Maven 项目
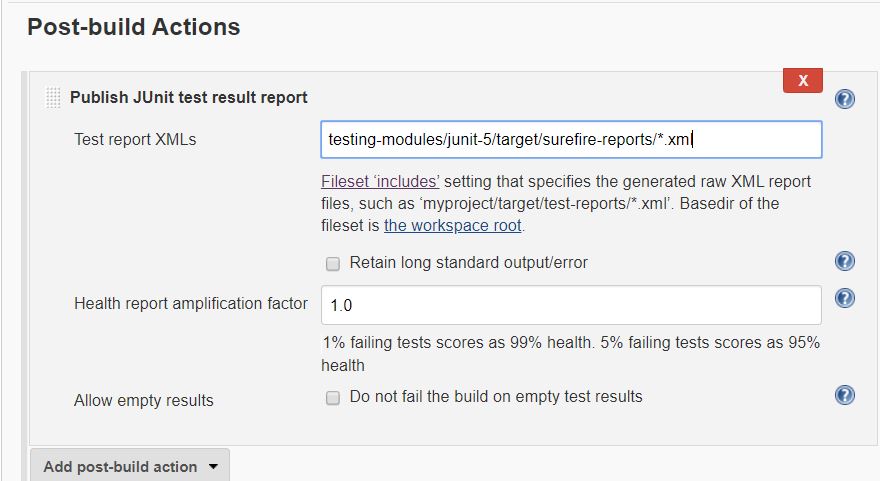
- 在构建后操作中,添加“发布 JUnit 测试结果报告”
- 指定 XML 报告路径,如
**/target/surefire-reports/*.xml
5.2 查看结果
配置完成后,Jenkins 会解析 XML 并展示测试详情:
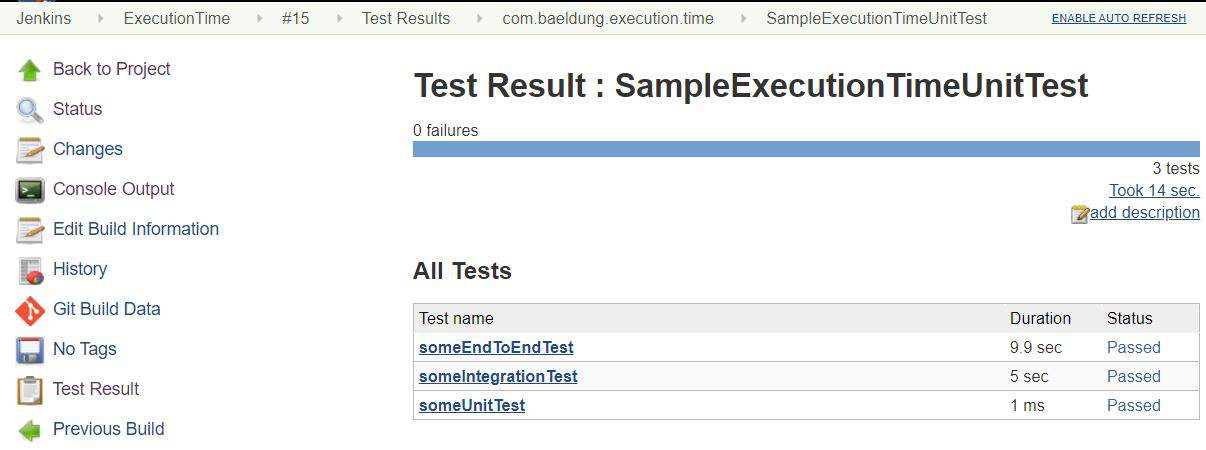
你将看到:
- ✅ 每次构建的测试通过率
- ✅ 各测试用例的执行耗时
- ✅ 历史趋势图,便于发现性能退化
💡 提示:在 Jenkins Pipeline 中也可通过 junit() 步骤实现相同功能。
6. 总结
本文系统介绍了获取 JUnit 测试执行时间的多种方式:
| 方式 | 适用场景 | 是否结构化 | 是否可归档 |
|---|---|---|---|
| IDE Runner | 本地开发调试 | ❌ | ✅(IntelliJ) |
| Maven 日志 | 快速验证 | ❌ | ❌ |
| Surefire XML | CI 集成、自动化分析 | ✅ | ✅ |
| HTML 报告 | 团队共享、文档归档 | ✅ | ✅ |
| Jenkins | 持续集成、趋势监控 | ✅ | ✅ |
✅ 推荐实践:
- 开发阶段用 IntelliJ 快速定位慢测试
- CI 流程中启用 Surefire XML 报告,并接入 Jenkins
- 定期分析耗时趋势,避免“测试膨胀”拖累交付效率
示例代码已上传至 GitHub:https://github.com/baeldung/tutorials/tree/master/testing-modules/junit-5