1. 概述
Gatling 是一款成熟高效的性能测试工具,可用于对REST应用施加负载测试。但直接从Gatling能看到的仅限于断言是否通过、服务器在压力测试期间是否崩溃等基础结果。
我们真正需要的信息远不止这些。通过性能测试,我们需要建立JVM监控机制,确保应用以最佳状态运行和响应。
本文将介绍如何搭建一套监控工具,在Gatling模拟测试执行时监控应用性能。我们将采用容器化方案,使用Docker Compose进行本地演示。完整监控方案需要以下组件:
✅ 暴露指标的REST应用:使用Spring Boot Actuator零配置获取所需指标
✅ Prometheus:从REST应用收集指标并存储为时序数据
✅ InfluxDB:时序数据库,用于收集Gatling指标
✅ Grafana:可视化工具,集成数据源并保存仪表盘
2. 搭建监控工具
为演示完整监控方案,我们将使用容器和Docker Compose快速启动所有工具。每个工具都需要创建Dockerfile,然后通过Docker Compose统一管理,简化服务间通信。
2.1. REST API
先准备用于性能测试的REST API。我们使用简单的Spring Boot MVC应用,包含两个接口。重点在于监控性能,因此两个接口都是模拟实现:
@RestController
public class PerformanceTestsController {
    @GetMapping("/api/fast-response")
    public ResponseEntity<String> getFastResponse() {
        return ResponseEntity.ok("响应够快吗?");
    }

    @GetMapping("/api/slow-response")
    public ResponseEntity<String> getSlowResponse() throws InterruptedException {
        int min = 1000;
        int max = 2000;
        TimeUnit.MILLISECONDS.sleep(ThreadLocalRandom.current()
            .nextInt(min, max));

        return ResponseEntity.ok("这花了点时间");
    }
}
第一个接口立即返回200响应,第二个接口会随机延迟1-2秒。通过Dockerfile容器化服务:
FROM openjdk:17-jdk-slim

COPY target/gatling-java.jar app.jar
ENTRYPOINT ["java","-jar","/app.jar"]

EXPOSE 8080
选择Java 17基础镜像,复制Spring Boot JAR包,设置容器启动命令和暴露端口(8080)。
2.2. Prometheus
创建Prometheus容器只需选择基础镜像,然后配置指标抓取目标。在configuration.yml中定义目标:
global:
  scrape_interval:     15s
  evaluation_interval: 15s

scrape_configs:
  - job_name: 'prometheus'
    static_configs:
      - targets: ['localhost:9090']
  - job_name: 'grafana'
    scrape_interval: 5s
    metrics_path: /metrics
    static_configs:
      - targets: ['grafana:3000']
  - job_name: 'service_metrics'
    scrape_interval: 5s
    metrics_path: /private/metrics
    static_configs:
      - targets: ['service:8080']
⚠️ 生产环境建议使用默认30秒间隔,避免频繁抓取造成噪音。配置三个抓取任务:
- prometheus:监控自身健康状态
- grafana:抓取Grafana指标(路径*/metrics*)
- service_metrics:抓取Spring Boot应用指标(路径由Actuator配置)
创建Dockerfile:
FROM prom/prometheus:v2.48.1

COPY config/prometheus-docker.yml /etc/prometheus/prometheus.yml

EXPOSE 9090:9090
选择Prometheus镜像版本,覆盖默认配置文件,暴露9090端口。
2.3. Gatling
创建Gatling模拟测试对两个接口施压。为更好演示,我们准备两个模拟测试类:
public class SlowEndpointSimulation extends Simulation {
    public SlowEndpointSimulation() {
        ChainBuilder getSlowEndpointChainBuilder
          = SimulationUtils.simpleGetRequest("request_slow_endpoint", "/api/slow-response", 200);
        PopulationBuilder slowResponsesPopulationBuilder
          = SimulationUtils.buildScenario("getSlowResponses", getSlowEndpointChainBuilder, 120, 30, 300);

        setUp(slowResponsesPopulationBuilder)
          .assertions(
            details("request_slow_endpoint").successfulRequests().percent().gt(95.00),
            details("request_slow_endpoint").responseTime().max().lte(10000)
          );
    }
}
SlowEndpointSimulation 对*/api/slow-response*接口施压:峰值120请求/秒,持续300秒,断言成功率>95%且响应时间<10秒。
public class FastEndpointSimulation extends Simulation {
    public FastEndpointSimulation() {
        ChainBuilder getFastEndpointChainBuilder
          = SimulationUtils.simpleGetRequest("request_fast_endpoint", "/api/fast-response", 200);
        PopulationBuilder fastResponsesPopulationBuilder
          = SimulationUtils.buildScenario("getFastResponses", getFastEndpointChainBuilder, 200, 30, 180);

        setUp(fastResponsesPopulationBuilder)
          .assertions(
            details("request_fast_endpoint").successfulRequests().percent().gt(95.00),
            details("request_fast_endpoint").responseTime().max().lte(10000)
          );
    }
}
FastEndpointSimulation 对*/api/fast-response*接口施压:200请求/秒,持续180秒。
为使Gatling指标可被监控,需配置Graphite输出。在gatling.conf中添加:
data {
  writers = [console, file, graphite]
  graphite {
    light = false
    host = "localhost"
    port = 2003
    protocol = "tcp"
    rootPathPrefix = "gatling"
    bufferSize = 8192
    writePeriod = 1
  }
}
配置Graphite写入器,指向InfluxDB的2003端口,指标前缀设为* Gatling*。Gatling测试将在Docker Compose启动后通过控制台执行。
2.4. InfluxDB
InfluxDB配置相对复杂,需要基础镜像、配置文件和启动脚本。在influxdb.conf中启用Graphite协议:
[[graphite]]
  enabled = true
  database = "graphite"
  retention-policy = ""
  bind-address = ":2003"
  protocol = "tcp"
  consistency-level = "one"
  batch-size = 5000
  batch-pending = 10
  batch-timeout = "1s"
  separator = "."
关键配置:
- enabled = true:启用Graphite协议
- *bind-address = ":2003"*:监听端口(需与Gatling配置一致)
创建entrypoint.sh初始化脚本:
#!/usr/bin/env sh

if [ ! -f "/var/lib/influxdb/.init" ]; then
    exec influxd -config /etc/influxdb/influxdb.conf $@ &

    until wget -q "http://localhost:8086/ping" 2> /dev/null; do
        sleep 1
    done

    influx -host=localhost -port=8086 -execute="CREATE USER ${INFLUX_USER} WITH PASSWORD '${INFLUX_PASSWORD}' WITH ALL PRIVILEGES"
    influx -host=localhost -port=8086 -execute="CREATE DATABASE ${INFLUX_DB}"

    touch "/var/lib/influxdb/.init"

    kill -s TERM %1
fi

exec influxd $@
脚本启动InfluxDB服务,等待服务就绪后创建用户和数据库。最后创建Dockerfile:
FROM influxdb:1.3.1-alpine

WORKDIR /app
COPY entrypoint.sh ./
RUN chmod u+x entrypoint.sh
COPY influxdb.conf /etc/influxdb/influxdb.conf

ENTRYPOINT ["/app/entrypoint.sh"]
复制配置文件和启动脚本,设置执行权限和入口点。
2.5. Grafana
启动Grafana容器较简单,但为保留配置和仪表盘,我们预置配置文件。先定义数据源datasources.yml:
datasources:
  - name: Prometheus-docker
    type: prometheus
    url: http://prometheus:9090
    access: proxy
    isDefault: false
  - name: InfluxDB
    type: influxdb
    url: http://influxdb:8086
    access: proxy
    jsonData:
      dbName: "graphite"
    isDefault: false
配置两个数据源:
- Prometheus:URL指向prometheus:9090
- InfluxDB:URL指向influxdb:8086,使用graphite数据库
定义仪表盘提供者dashboards.yml:
providers:
  - name: 'dashboards'
    type: file
    options:
      path: /etc/grafana/provisioning/dashboards
      foldersFromFilesStructure: true
创建Dockerfile:
FROM grafana/grafana:10.2.2

COPY provisioning/ /etc/grafana/provisioning/
COPY dashboards/ /etc/grafana/provisioning/dashboards

EXPOSE 3000:3000
复制配置文件和仪表盘JSON文件(本文省略具体仪表盘内容),暴露3000端口。
2.6. Docker Compose
整合所有服务到docker-compose.yml:
services:
  influxdb:
    build: influxDb
    ports:
      - '8086:8086'
      - '2003:2003'
    environment:
      - INFLUX_USER=admin
      - INFLUX_PASSWORD=admin
      - INFLUX_DB=influx

  prometheus:
    build: prometheus
    depends_on:
      - service
    ports:
      - "9090:9090"

  grafana:
    build: grafana
    ports:
      - "3000:3000"

  service:
    build: .
    ports:
      - "8080:8080"
启动四个服务:
- influxdb:暴露8086和2003端口
- prometheus:依赖service启动
- grafana:暴露3000端口
- service:暴露8080端口
3. 监控Gatling测试
工具搭建完成后,通过Docker Compose启动监控服务和REST API,执行Gatling性能测试,使用Grafana监控性能指标。
3.1. 执行测试
终端运行docker-compose up --build启动所有服务。服务就绪后,通过Maven执行Gatling模拟测试:
mvn gatling:test -Dgatling.simulationClass=org.baeldung.FastEndpointSimulation
测试结果示例:
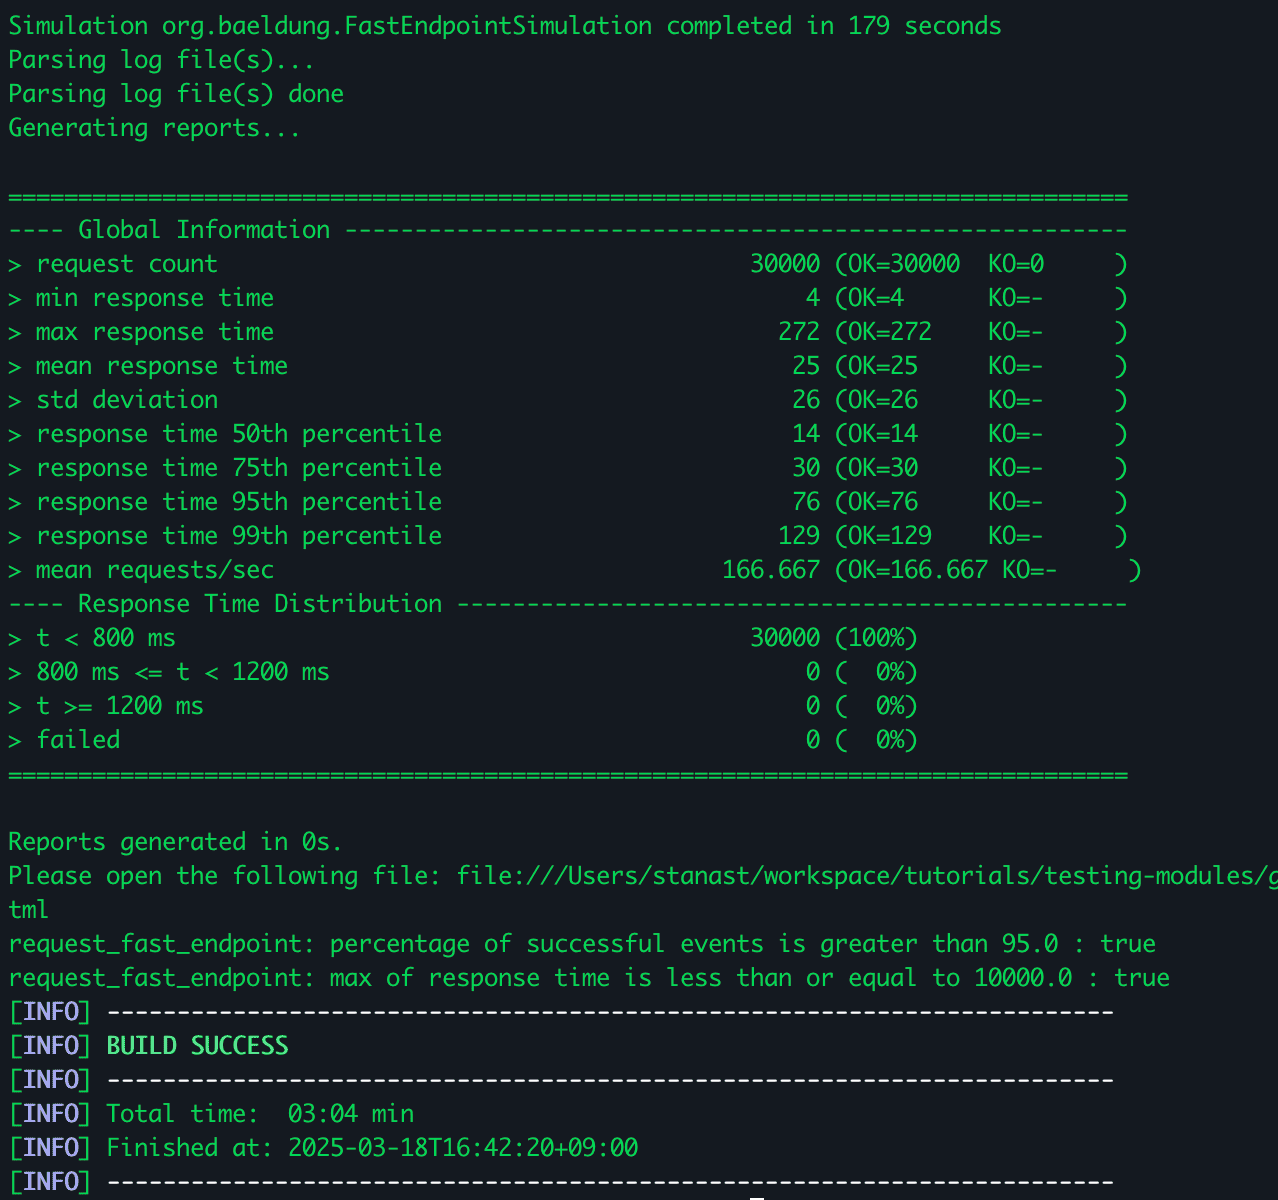
结果显示"模拟测试在179秒内完成",所有断言通过。
3.2. Grafana仪表盘监控
访问Grafana(http://localhost:3000),使用admin/admin登录。预置两个仪表盘:
应用指标仪表盘:
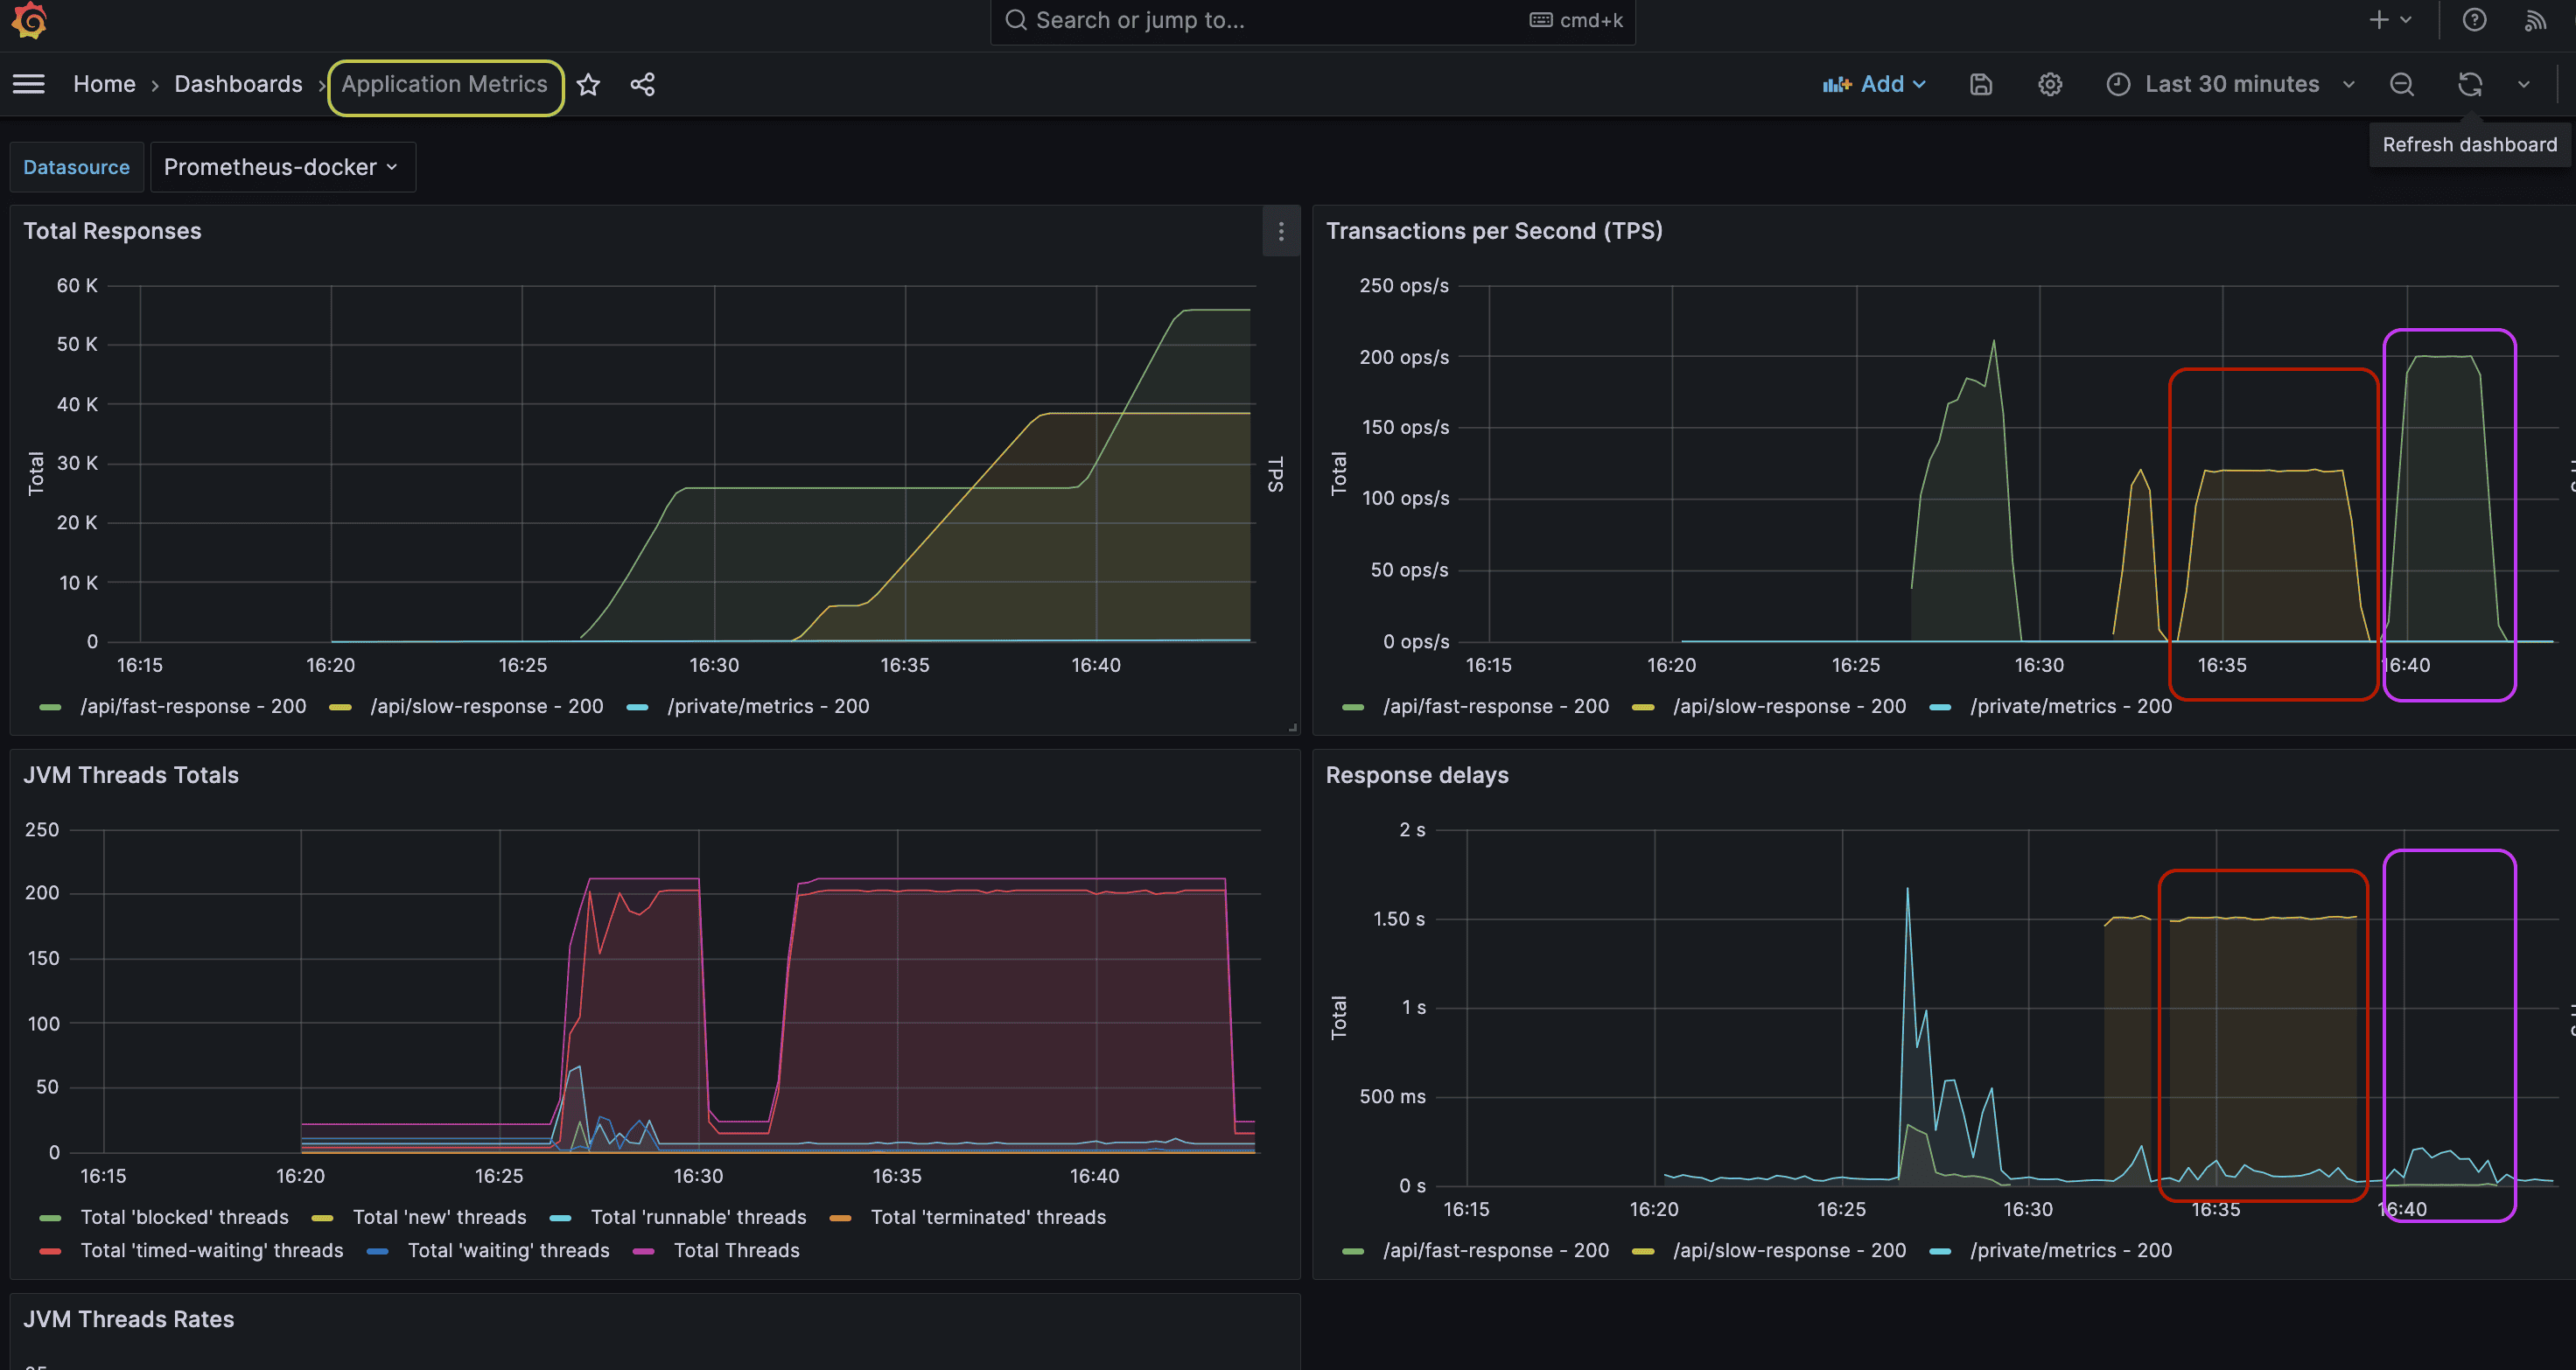
关键指标分析:
- 🔴 红圈:慢接口测试(300秒,120 TPS,延迟约1.5秒)
- 🟣 紫标:快接口测试(180秒,200 TPS,延迟极低)
Gatling指标仪表盘:
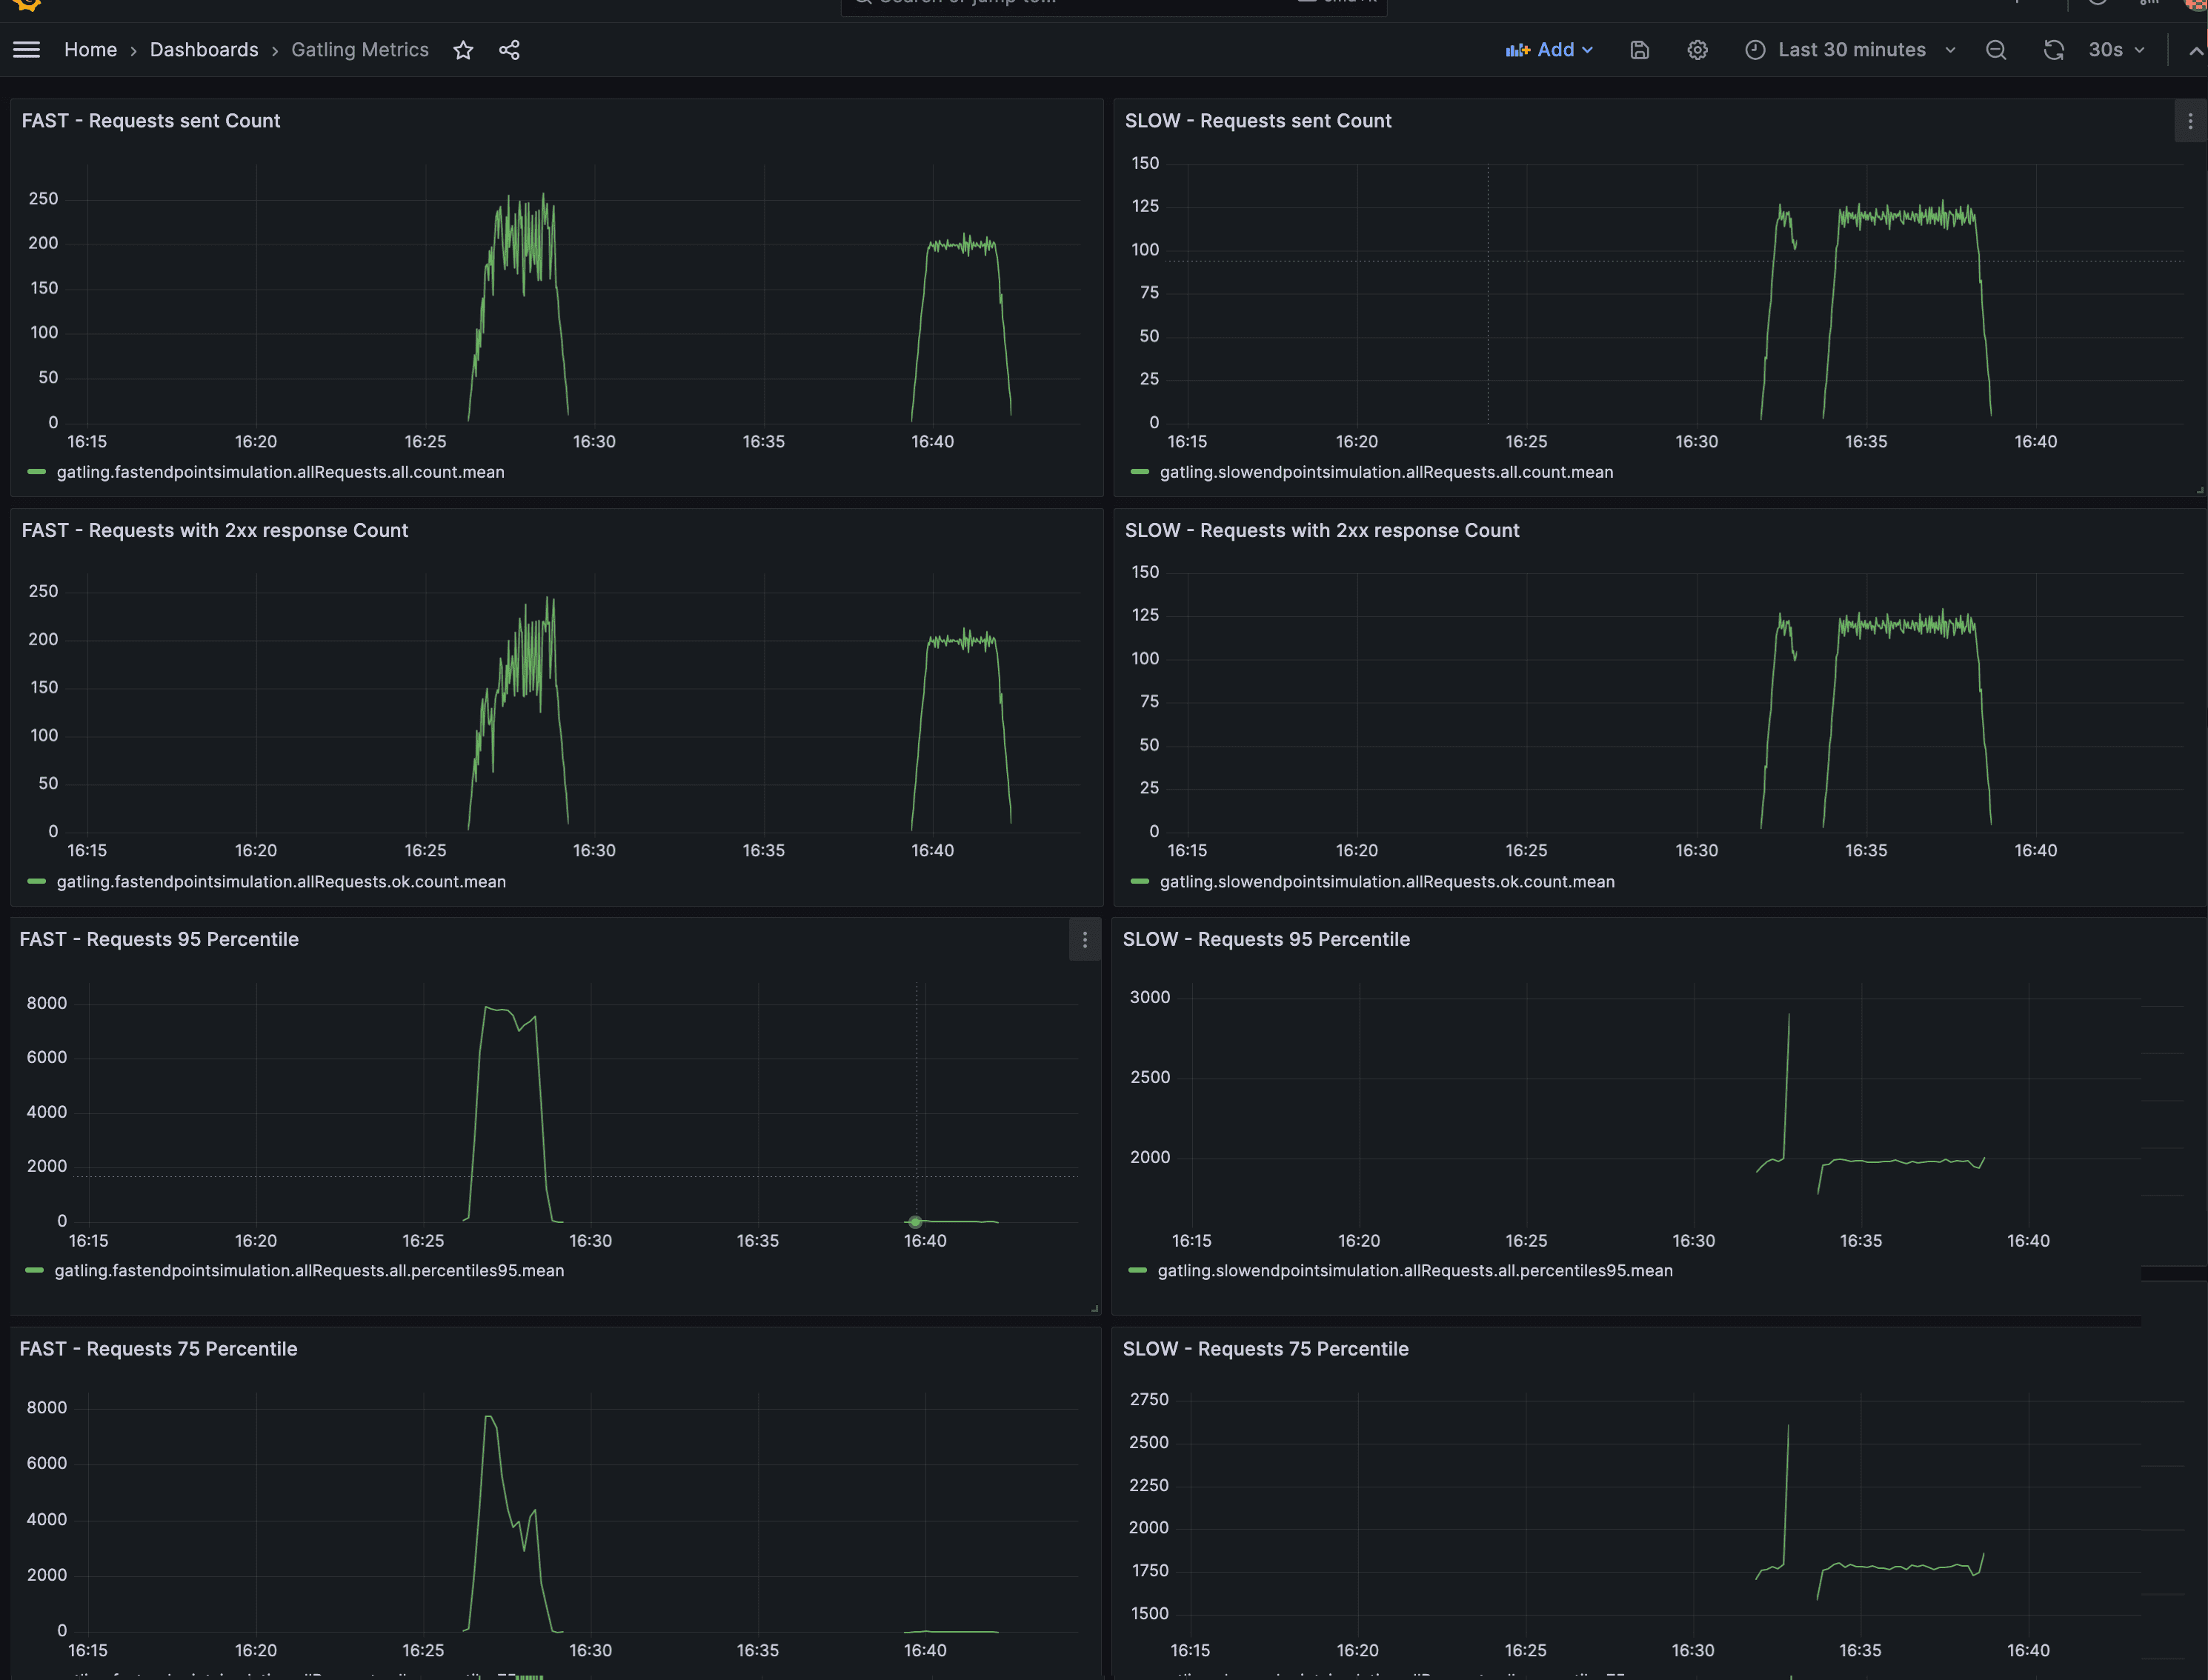
仪表盘左右两侧分别展示快/慢接口测试的客户端视角指标,包括响应状态码、延迟分布等。
3.3. 结果分析
通过监控指标,可识别性能瓶颈并优化JVM配置:
JVM线程指标:
- 观察各接口的线程使用量
- 若某接口线程数异常偏高,可能存在线程滥用问题
垃圾回收(GC)指标:
- ⚠️ 必须监控GC频率和持续时间
- 对比不同GC策略(如G1 vs ZGC)的性能表现
- 通过重测寻找最优JVM配置
4. 总结
本文介绍了Gatling性能测试的完整监控方案:
- 搭建Prometheus+InfluxDB+Grafana监控栈
- 容器化部署Spring Boot应用和监控工具
- 通过Grafana仪表盘分析应用和测试指标
- 重点监控JVM线程和GC指标优化性能
这套方案能帮助开发者深入理解系统性能表现,避免"只测不监"的盲区。建议在实际项目中根据业务需求定制监控指标和告警规则。