1. Introduction
Ticks on axes help us orient in a plot and understand the mapping from the x to y values. Usually, major ticks are labeled, while minor ticks are drawn without labels to avoid cluttering the plot.
In this tutorial, we’ll explain four ways to customize ticks in Matplotlib:
- use set_xticks() and set_yticks() to manually set the locations and labels of the major and minor ticks
- use Locator and Formatter classes to automatically determine, position, and label axis ticks
- customize the appearance of tick lines and labels via tick_params()
- *use loglog(), semilogx(), and semilogy() to quickly set logarithmic scales* on one or both axes
We’ll illustrate these methods on numeric data. The Matplotlib documentation explains how to set ticks for time series and dates.
2. Why Customize Ticks?
Matplotlib has a pretty good default system of choosing tick values and formatting their labels, but sometimes, we need to customize the ticks.
For example, if we plot trigonometric functions, it makes sense to use the multiples of pi as ticks on the x-axis. However, Matplotlib doesn’t interpret plots, so it doesn’t know that the multiples of pi are natural ticks in this case.
3. Set Tick Locations and Labels Manually
To set major and minor ticks on the x-axis, we can use the set_xticks() method of the Axes object in the object-oriented API or matplotlib.pyplot.xticks() in the state-based API of Matplotlib.
Here’s the syntax of set_xticks():
axs.set_xticks(ticks, labels=None, *, minor=False, **kwargs)
Here:
- axs is the Axes object for which we’re setting the ticks of the x-axis
- ticks is the list or an array of the tick values
- labels is the array of labels and has to be of the same size as ticks
- minor=False means we’ll set the major ticks, and minor=True indicates we’ll set the minor ticks
- kwargs are keyword arguments we can pass to format the labels if the array labels is set
If labels=None, Matplotlib will use its default system to determine the labels:
- Major ticks’ values will be used as labels
- Minor ticks will have no labels
*This also holds for the y-axis, for which we have set_yticks() and matplotlib.pyplot.yticks().*
3.1. Example
As we said, it’s more meaningful to have the multiples of pi as ticks for a trigonometric function. Let’s set the major ticks to integer multiples and minor ticks to the multiples of 0.5pi in the plot of the sine function:
import matplotlib.pyplot as plt
import numpy as np

# The x and y values for the sine function
x = np.linspace(0, 6, 500) * np.pi
y = np.sin(x)

# Create a figure
fig, axs = plt.subplots(figsize=(5, 4))

# Plot the sine line
axs.plot(x, y)

# Set the major ticks to the multiples of pi: 0, pi, 2pi, 3pi, 4pi, 5pi, 6pi
major_ticks = np.arange(0, 6.1, 1) * np.pi
# Use 0, pi, 2pi, ..., 6pi as tick labels
major_labels = ['0', ''] + [f'' for i in [2, 3, 4, 5, 6]]

# Set the minor ticks to 0, pi/4, pi/2, ...
minor_ticks = np.arange(0, 6.1, 0.5) * np.pi
# Use empty labels
minor_labels = np.repeat('', len(minor_ticks))

# Set the major and minor ticks on the x axis
axs.set_xticks(major_ticks, labels=major_labels, minor=False)
axs.set_xticks(minor_ticks, labels=minor_labels, minor=True)
We use LaTeX formatting to get the math  symbol*.* The result is:
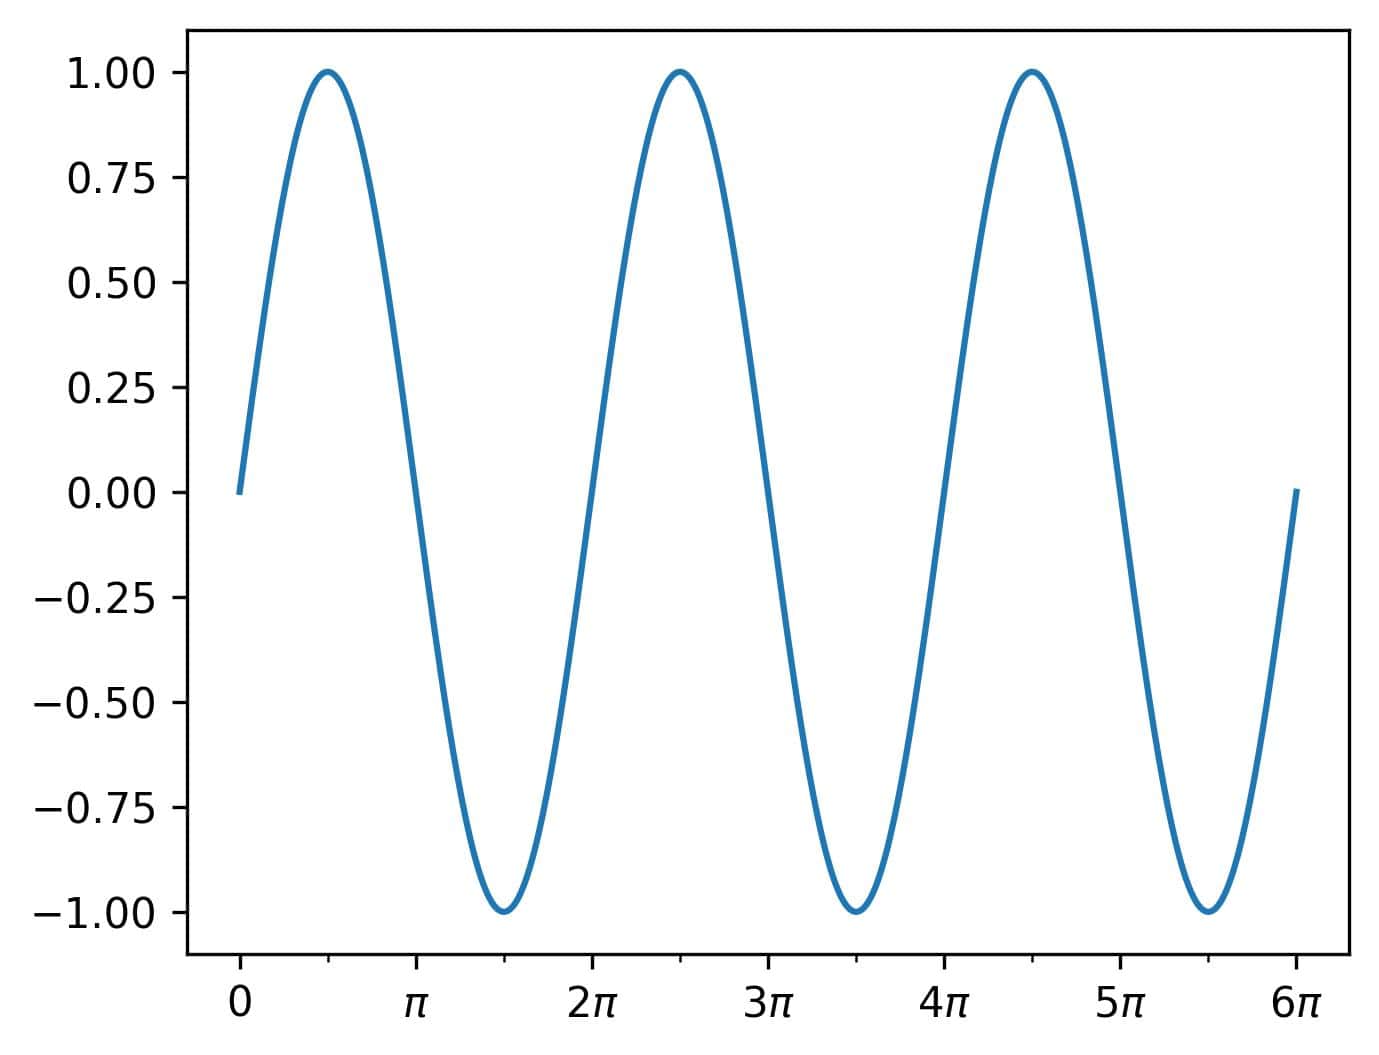
These ticks are much more meaningful than the default ones:

In this example, we set the labels and minor parameters explicitly, but if we used their default settings, we could get the same results:
axs.set_xticks(major_ticks, labels=major_labels)
axs.set_xticks(minor_ticks, minor=True)
4. Using Locators and Formatters
In Matplotlib, we have two classes that specify the position of ticks and the appearance of their labels: Locator and Formatter.
We subclass them to implement our own locators and formatters or use the pre-existing classes that come with Matplotlib and cover many use cases.
Their advantage over the manual approach is that they automatize the calculation and label formatting. For instance, if we changed the x range for the sine function, we’d have to adjust the x ticks explicitly. However, with a locator, we’d implement a rule for choosing the ticks, which would be applied to any range of the x values.
4.1. Locators
A locator is an object of the Locator class or its subclass. It specifies the positions of axis ticks based on the range of values the axis covers.
Matplotlib has several ready-to-use locators, and here are some of them:
Locator
Description
MaxNLocator
Selects and uses no more than the given number of points as ticks.
AutoLocator
The default locator. Essentially, MaxNLocator with the default parameter settings.
LinearLocator
Ticks are evenly spaced between the axis endpoints.
LogLocator
The logarithms of the ticks are evenly spaced between the axis endpoints.
MultipleLocator
Tick values are multiples of the same base value plus an optional offset.
FixedLocator
Ticks are fixed values.
NullLocator
The axis is without ticks.
These locators are in matplotlib.ticker and can override the major and minor locators on both axes:
axs.xaxis.set_major_locator(x_major_locator)
axs.xaxis.set_minor_locator(x_minor_locator)
axs.yaxis.set_major_locator(y_major_locator)
axs.yaxis.set_minor_locator(y_minor_locator)
We reference the x-axis of the Axes object axs as axs.xaxis. Similarly, we access the y-axis as axs.yaxis. *To set the locators for the minor and major ticks, we use the methods set_major_locator() and set_minor_locator().*
4.2. Example With Locators
Let’s set the major ticks:
import matplotlib.pyplot as plt
from matplotlib.ticker import AutoLocator, MaxNLocator, LinearLocator, LogLocator, MultipleLocator
import numpy as np

# Generate data
x = np.linspace(0, 5, 100) * np.pi
y = np.sin(x)

# Make a figure with five subplots
fig, axs = plt.subplots(nrows=5,
                        ncols=1,
                        figsize=(5, 5),
                        layout='constrained')
axs[0].plot(x, y)
axs[0].xaxis.set_major_locator(AutoLocator())
axs[0].set_title('AutoLocator')

axs[1].plot(x, y)
axs[1].xaxis.set_major_locator(MaxNLocator(nbins=4))
axs[1].set_title('MaxNLocator(nbins=4)')

axs[2].plot(x, y)
axs[2].xaxis.set_major_locator(LinearLocator(numticks=5))
axs[2].set_title('LinearLocator(numticks=5)')

axs[3].plot(x, y)
axs[3].xaxis.set_major_locator(LogLocator(numticks=5))
axs[3].set_title('LogLocator(numticks=5)')

axs[4].plot(x, y)
axs[4].xaxis.set_major_locator(MultipleLocator(base=np.pi))
axs[4].set_title('MultipleLocator(base=3.14)')

fig.savefig('matplotlib_locators.jpg', dpi=300, bbox_inches='tight')
We created a figure with five subplots. In MultipleLocator, we used pi as the base. We instructed LinearLocator to use five ticks, MaxNLocator to use at most four, and LogLocator to use no more than five:
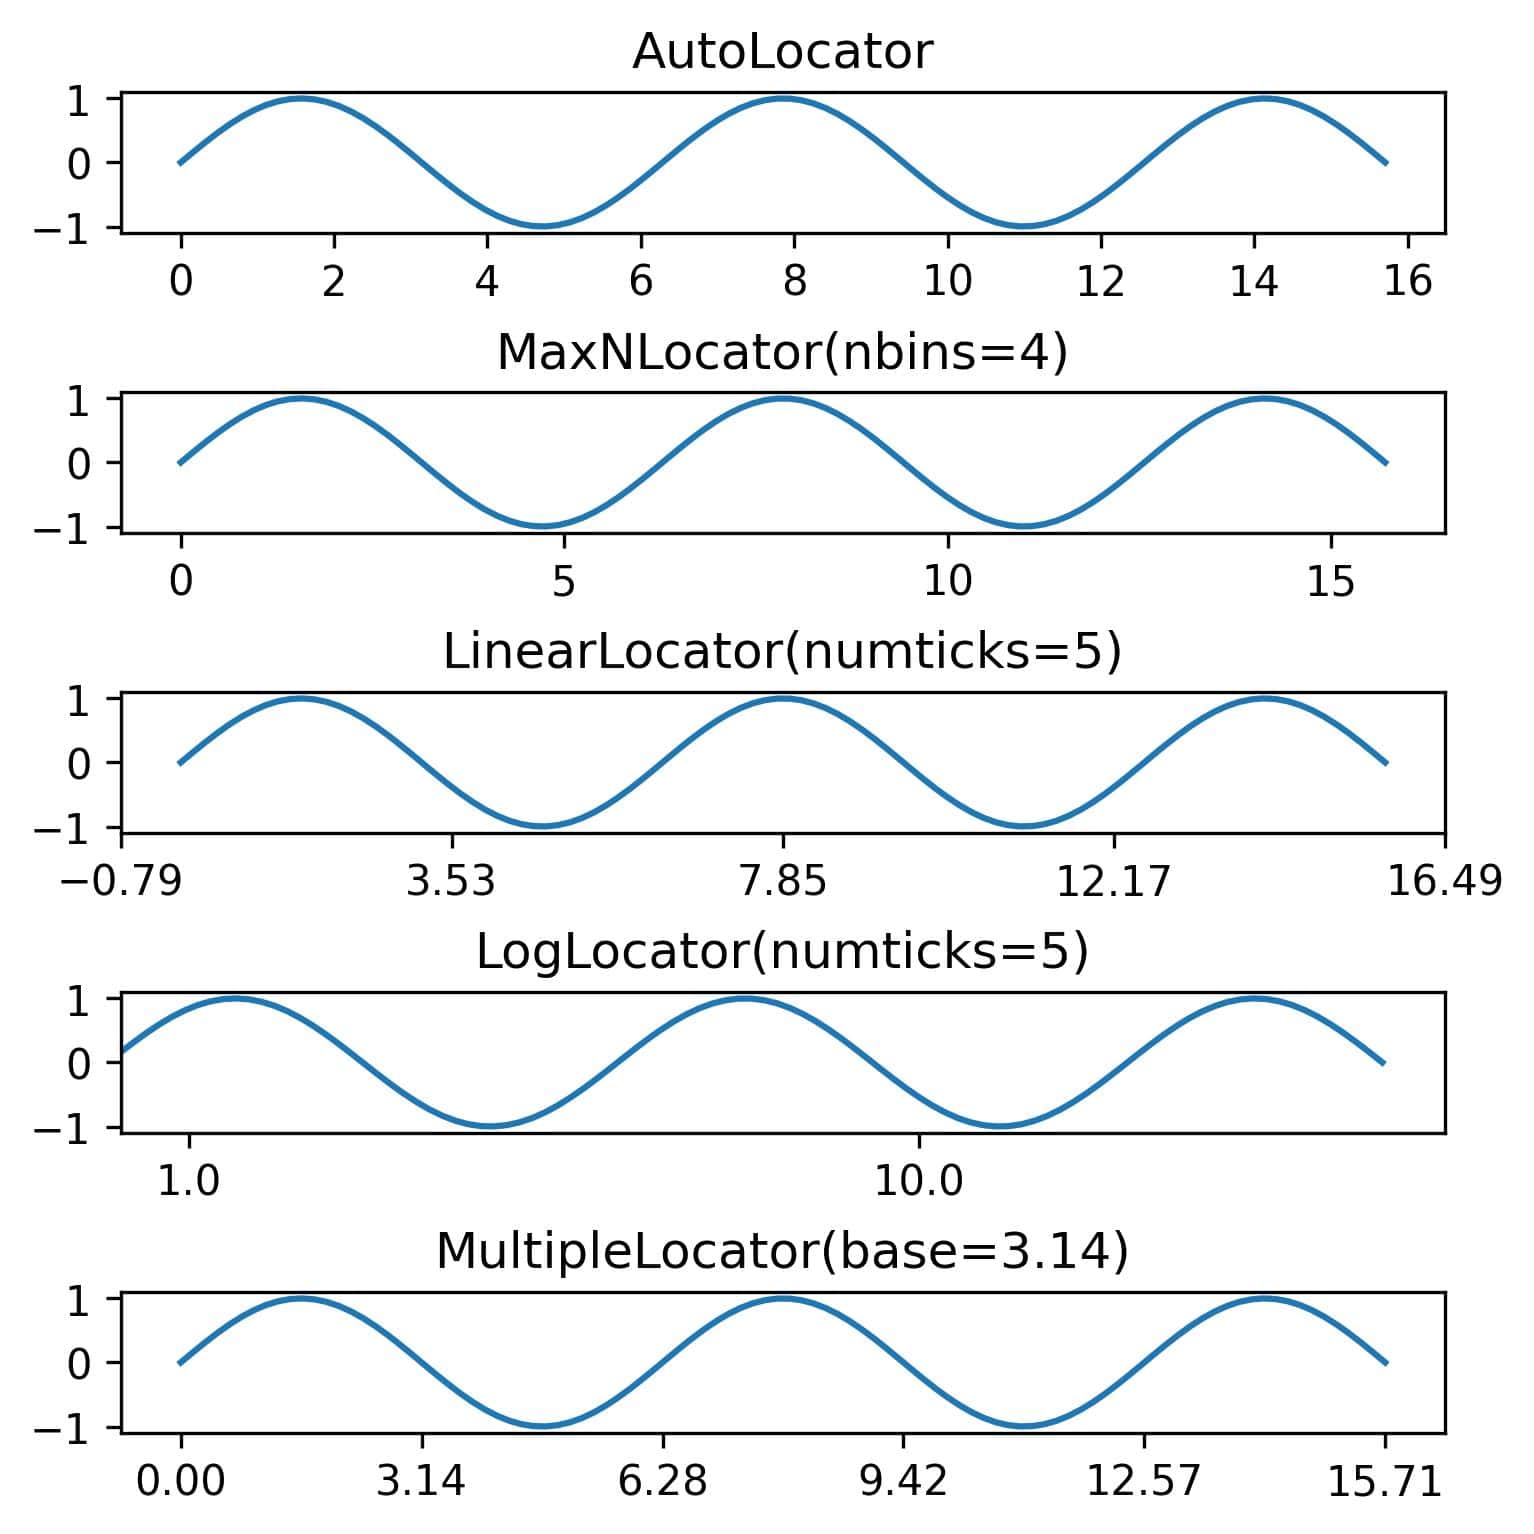
By default, LogLocator uses 10 as the base and integers as exponents. Only the powers 10^0=1 and 10^1=10 were shown as ticks because the data range is [0, 5pi).
4.3. Formatters
A formatter is an object of the Formatter class or its subclass. While a locator chooses tick values, a formatter specifies how they will be displayed in the corresponding tick labels.
Here are some of the Matplotlib ready-to-use formatters:
Formatter
Decription
FixedFormatter
Fixed strings are used as labels.
StrMethodFormatter
Uses a format string to turn a tick value into a label.
FuncFormatter
A user-defined function formats values as labels.
ScalarFormatter
Formats the tick values as numbers.
PercentFormater
A tick’s label is the ratio of the tick’s value to the parameter xmax and is expressed as a percentage.
NullFormatter
No labels are used.
*We set the formatters using the methods set_major_formatter() and set_minor_formatter():*
axs.xaxis.set_major_formatter(x_major_formatter)
axs.xaxis.set_minor_formatter(x_minor_formatter)
axs.yaxis.set_major_formatter(y_major_formatter)
axs.yaxis.set_minor_formatter(y_minor_formatter)
Note that a user function is automatically converted into FuncFormatter and a format string into StrMethodFormatter. A format string should denote the tick value as x.
4.4. Example with Formatters
Now, let’s try out various formatters while using the multiples of pi as tick values.
We’ll use the following function for FuncFormatter:
def format_func(x, pos):
    r = x / np.pi
    if r == 0:
        return '0'
    elif r == 1:
        return ''
    else:
        if np.isclose(r, round(r)):
            return f''
        else:
            return f''
It will produce labels 0, pi, 2pi, 3pi… or 2.15pi, 3.45pi, etc., if the value isn’t an integer multiple of pi.
Matplotlib will instantiate FuncFormatter if we supply a function to the formatter setter. Similarly, a string will be converted to StrMethodFormatter:
import matplotlib.pyplot as plt
from matplotlib.ticker import FuncFormatter, ScalarFormatter, PercentFormatter, MultipleLocator
from matplotlib.ticker import FixedLocator, FixedFormatter
import numpy as np

# Generate data
x = np.linspace(0, 5, 100) * np.pi
y = np.sin(x)

# Make a figure with a subplot grid
fig, axs = plt.subplots(nrows=5,
                        ncols=1,
                        figsize=(5, 4),
                        layout='constrained')

# Set the locator and plot the line
for ax in axs:
    ax.xaxis.set_major_locator(MultipleLocator(base=np.pi))
    ax.plot(x, y)

# Set the formatters for the subplots

axs[0].xaxis.set_major_formatter(ScalarFormatter())
axs[0].set_title('ScalarFormatter')

axs[1].xaxis.set_major_formatter('{x:.3f}')
axs[1].set_title('StrMethodFormatter')

axs[2].xaxis.set_major_formatter(format_func)
axs[2].set_title('FuncFormatter')

max_x = np.round(max(x), 2)
axs[3].xaxis.set_major_formatter(PercentFormatter(xmax=max_x))
axs[3].set_title(f'PercentFormatter(xmax={max_x})')

# For FixedFormatter, use FixedLocator; otherwise, the label placement is unpredictable
axs[4].xaxis.set_major_locator(FixedLocator(np.arange(0, 6.1, 1) * np.pi))
axs[4].xaxis.set_major_formatter(FixedFormatter(['A', 'B', 'B', 'D', 'E', 'F']))
axs[4].set_title('FixedLocator + FixedFormatter')
The result:
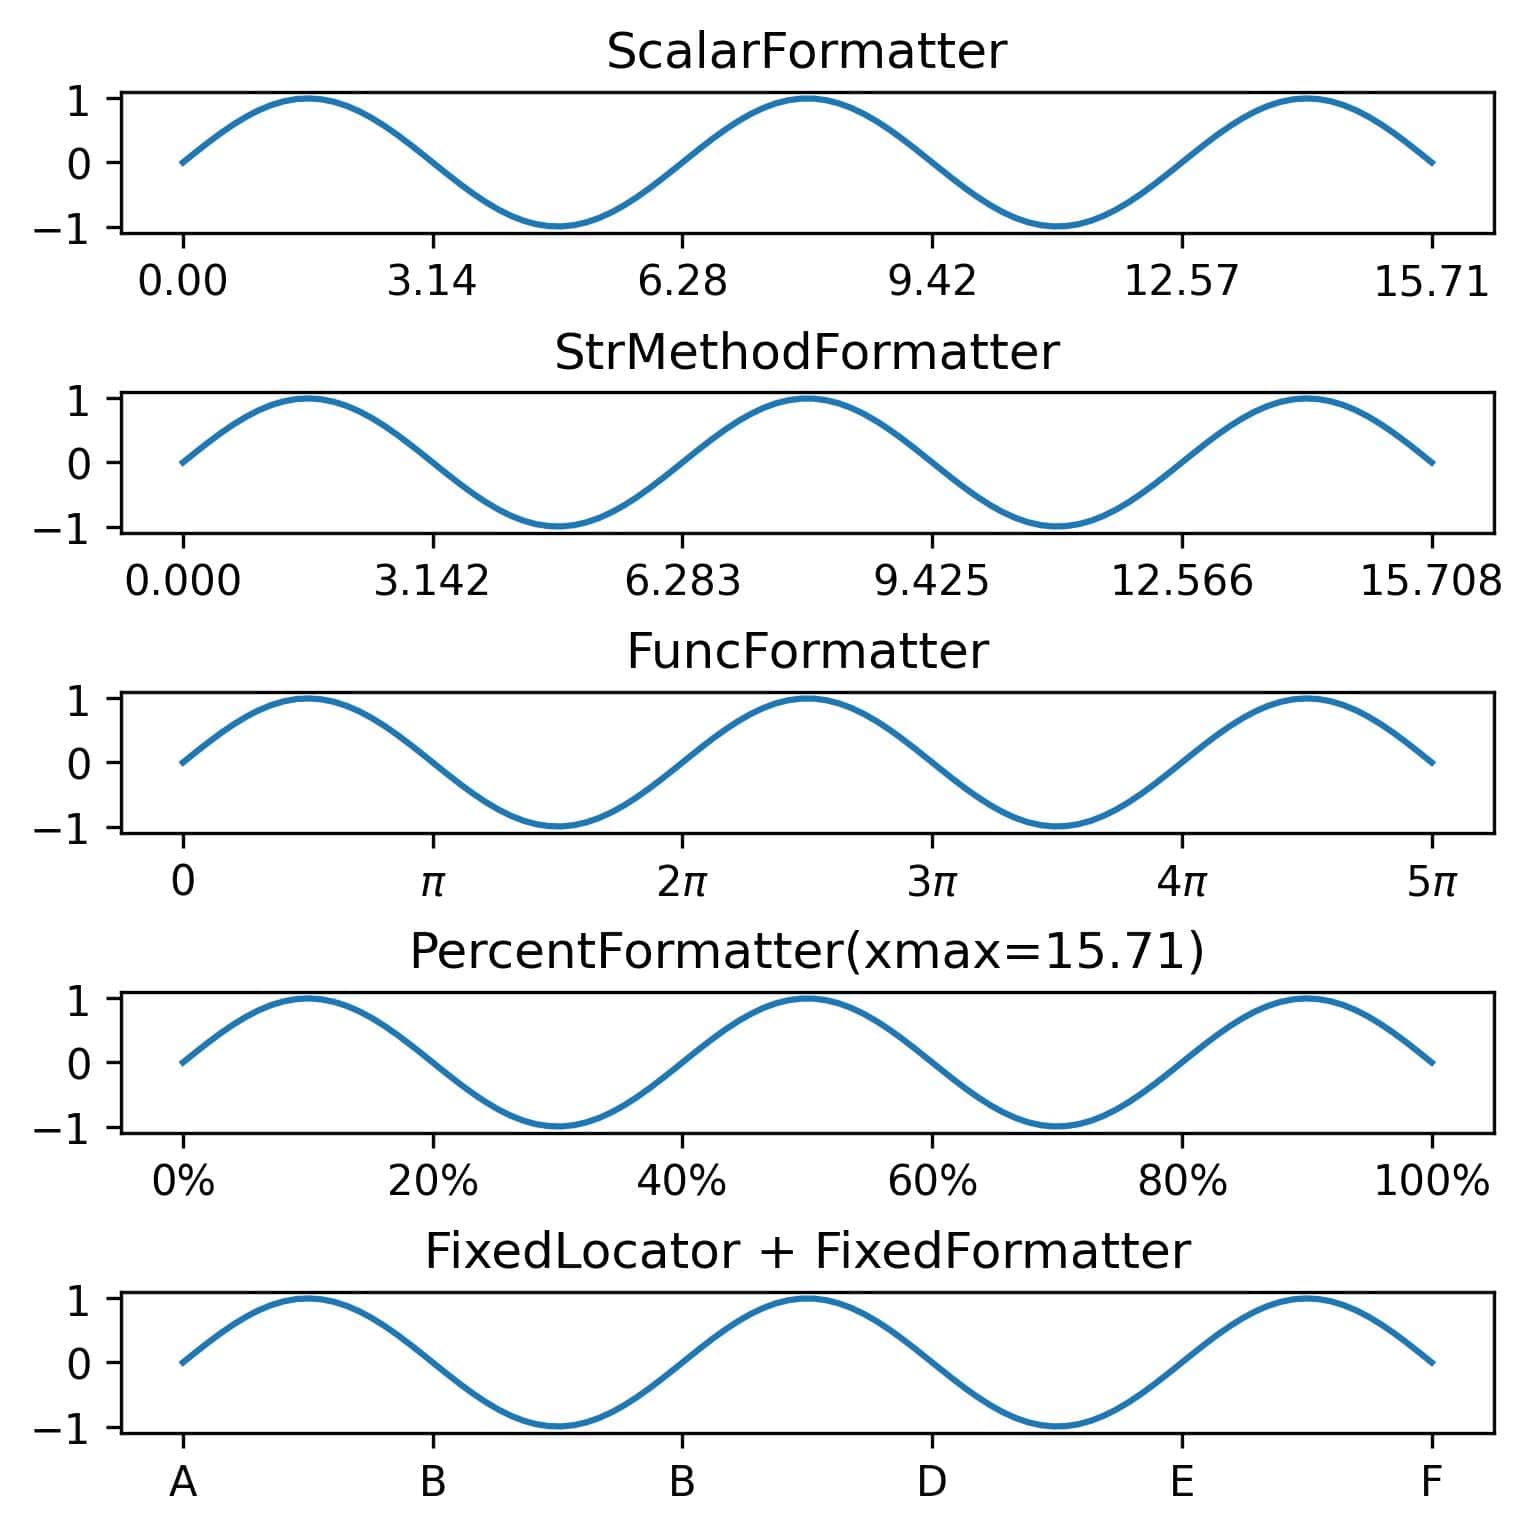
FixedFormatter should be used with FixedLocator to place the labels next to the tick marks. If we use another locator, the placement of the tick labels will be unpredictable.
5. Change the Appearance Using tick_params()
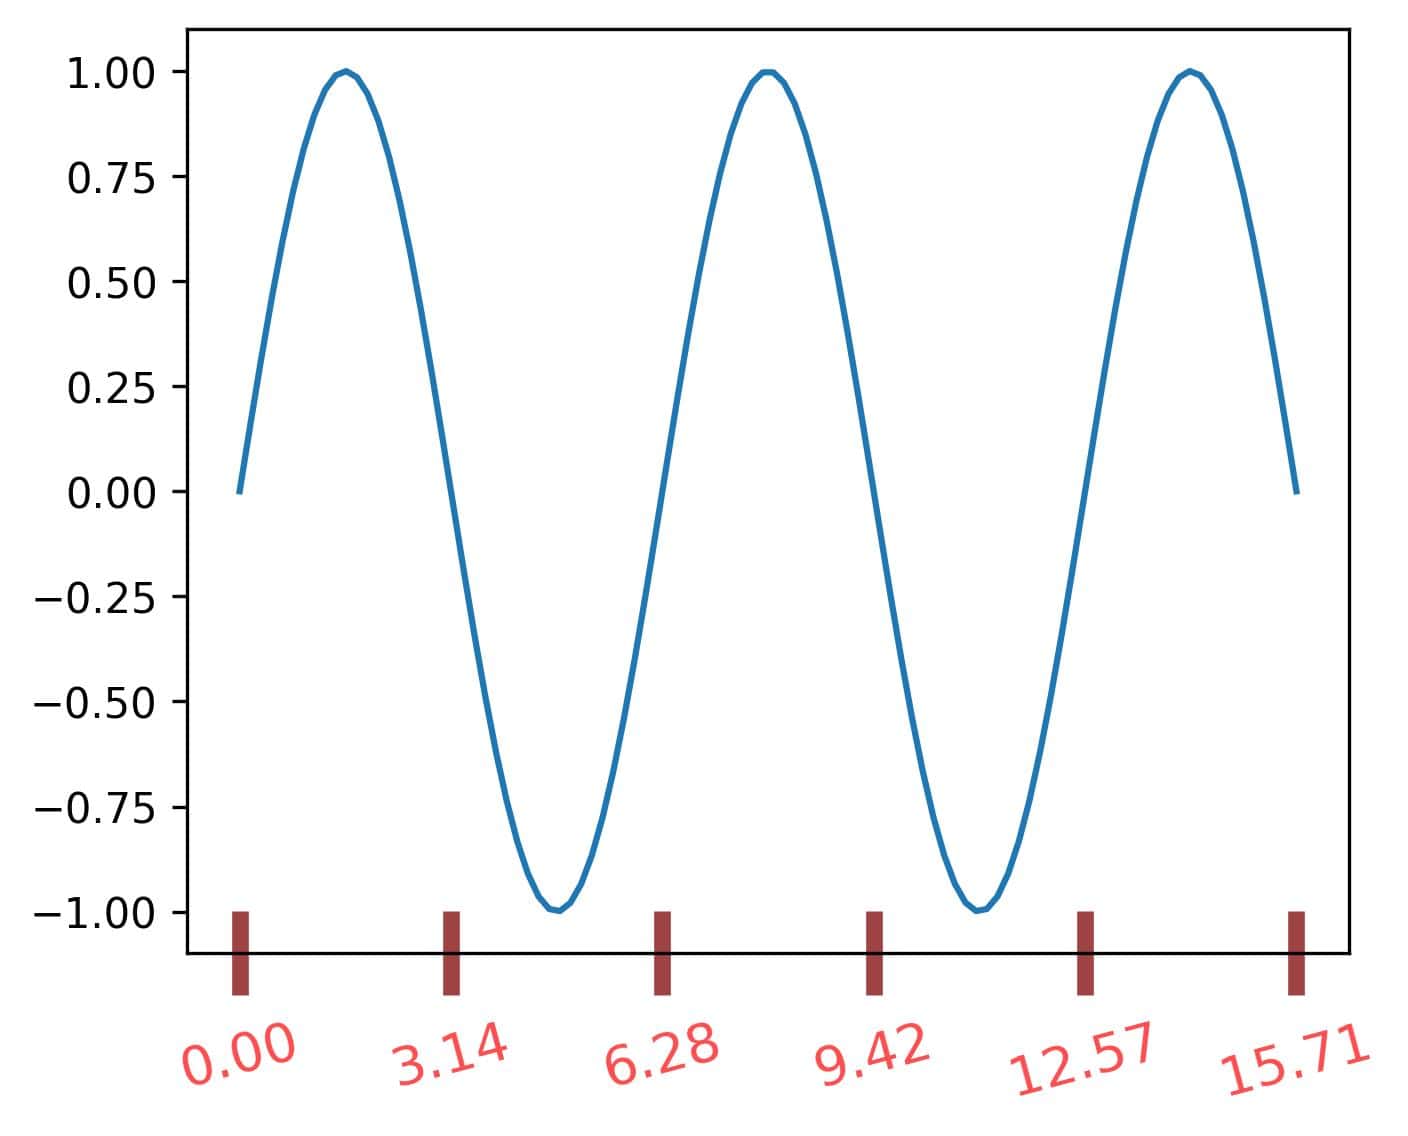
The tick_params() method of Axes objects sets the visual elements of ticks and their labels in the plot, such as color and size. We need to specify the axis (‘x’, ‘y’, or ‘both’) and tick type (‘major’, ‘minor’, or ‘both’) for which the settings will apply.
For example:
fig, axs = plt.subplots(figsize=(5, 4))

x = np.linspace(0, 5, 100) * np.pi
y = np.sin(x)

axs.plot(x, y)
axs.xaxis.set_major_locator(MultipleLocator(np.pi))

axs.tick_params(
    axis='x',            # which axis
    which='major',       # which ticks
    direction='inout',   # are ticks inside or outside the plot, or cross the axis
    length=20,           # tick length
    width=4,             # tick width
    color='#9e4244',     # tick color
    pad=5,               # distance between ticks and labels
    labelsize=13,        # label font
    labelrotation=15,    # label angle
    labelcolor='#fc4c4e' # label color
)
Here’s how the plot looks:
6. Shortcuts for Logarithmic Scales
Logarithmic scales are used so often that Matplotlib provides specialized plotting methods that set the axes to use logarithms and handle tick locations and label formatting for us. Those are:
- loglog(): both axes use the logarithmic scale with the same base
- semilogx(): the x-axis will be logarithmic
- semilogy(): the y-axis will be logarithmic
All three methods take the following parameters:
- base: the base of the logarithm (default value = 10)
- subs: the minor ticks’ locations
- nonpositive: if set to ‘mask’, it masks nonpositive values as invalid, and if set to ‘clip’, replaces them with a small positive number.
We use these methods the same way as plot():
import matplotlib.pyplot as plt
import numpy as np
x = np.linspace(0.1, 1000, 500)
y = x**1.5 - x

fig, axs = plt.subplots(nrows=2, ncols=2,
                        layout='constrained',
                        figsize=(6.5, 6.5))

axs[0][0].plot(x, y)
axs[0][0].set_title('(x, y)')

axs[0][1].semilogx(x, y)
axs[0][1].set_title('(log_10 x, y)')

axs[1][0].semilogy(x, y)
axs[1][0].set_title('(x, log_10 y)')

axs[1][1].loglog(x, y)
axs[1][1].set_title('(log_10 x, log_10 y)')
Here’s the resulting figure:

Here, we changed the axis scales, not just the ticks, so the shape of the line changed as well.
7. Conclusion
In this article, we presented four ways to control ticks and their labels in Matplotlib plots. The manual method with set_xticks() and set_yticks() is suitable for one or two plots, but if we need to specify the tick settings for multiple plots, it’s better to use locators and formatters.
To learn more about Matplotlib:
- follow our tutorial on setting the figure size
- learn how to draw a figure with multiple subplots