1. Introduction
Most plotting frameworks, including Matplotlib, have default values for figure sizes and resolutions (expressed in dots per inch or dpi). However, in some cases, we need to use different values. For example, there may be strict formatting guidelines regarding the image width and height or the maximum size in pixels.
In this tutorial, we’ll learn to set the width, height, and dpi in three ways:
- when creating a figure
- by modifying an existing figure
- upon saving a figure to a file
- by changing the default settings in rcParams
2. Setting the Size When Creating a Figure
We can control the size in inches and pixels by setting the parameters figsize and dpi.
We can pass those parameters to several methods that create figures in Matplotlib. If we import matplotlib.pyplot as plt, those are:
- plt.figure()
- plt.subplots()
2.1. Setting the Width and Height
The parameter figsize is a pair of numbers (integers or floats). The first specifies the width, while the second sets the height.
Both values denote inches.
For example:
import matplotlib.pyplot as plt

# Set width = 5 inches and height = 4 inches
figure = plt.figure(figsize=(5, 4))

# Draw a bar plot
plt.bar(['A', 'B', 'C', 'D'], [1, 2, 3, 4])

# Set the title
plt.title(f'Width = {width}, Height = {height}')

# Show the figure
plt.show()

# Let Matplotlib delete the figure to avoid wasting memory
figure.clear()
Here, we used plt.figure(), but we can also pass figsize to plt.subplots(). The resulting figure is 5 inches wide and 4 inches tall.
If we want to specify its width and height in other units, such as centimeters, we must do the conversion manually. As 1 inch = 2.54 cm, we divide the desired sizes in centimeters by 2.54:
# Set width = 10 cm and height = 8 cm
figure = plt.figure(figsize=(10 / 2.54, 8 / 2.54))
2.2. Setting the Size in Pixels
The parameter dpi specifies how many pixels there are in an inch. So, the total number of pixels in a figure is:
![[(width \times dpi) \times (height \times dpi) = width \times height \times dpi^2]](/wp-content/ql-cache/quicklatex.com-35ed295dea9b7754b136f33e6bb01763_l3.svg "Rendered by QuickLaTeX.com")
The greater the value, the larger the image on a display screen. So, we can change the pixel size of an image by varying only dpi:
width (inches)
height (inches)
dpi
size in pixels
5
4
100
200k
5
4
200
800k
5
4
500
5M
5
4
1000
20M
We set the number of pixels per inch via the parameter dpi:
for dpi in [72, 150]:
    # Set the dpi
    figure = plt.figure(figsize=(5, 4), dpi=dpi)

    # Create a bar plot
    plt.bar(['A', 'B', 'C', 'D'], height=[1, 2, 3, 4])

    # Set the title
    plt.title(f'DPI={dpi}')

    # Save the figure
    plt.savefig(f'dpi_{dpi}.jpg')
Here are these two images side by side in a pdf:
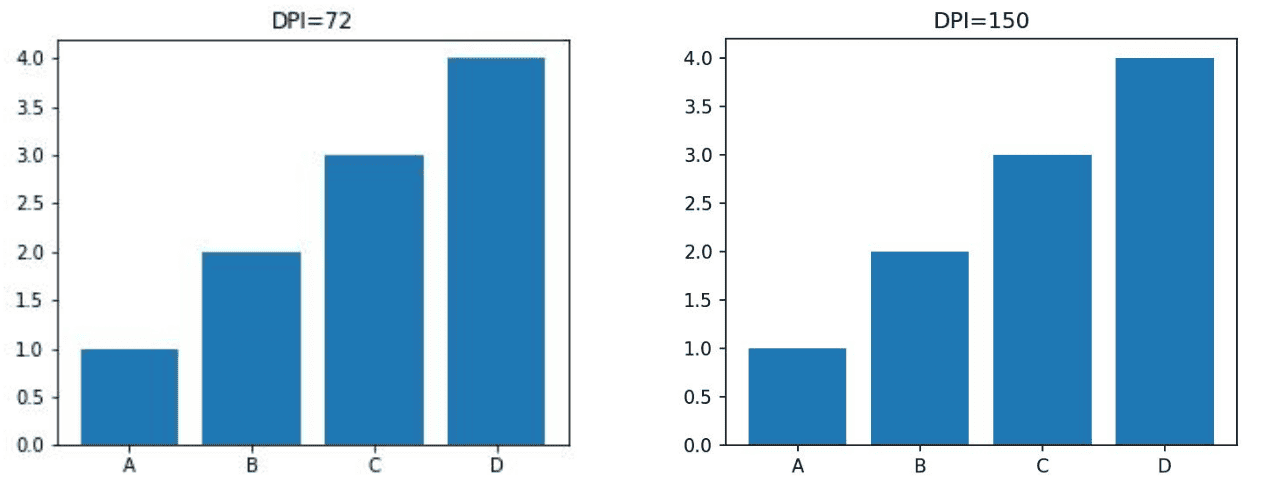
They have the same width and height in inches, but since the right one has a larger dpi, it has a larger pixel density and is clearer. However, on a screen, their exact sizes in inches or centimeters would depend on the screen resolution, but the right one would be larger.
3. Setting the Size of an Existing Figure
The class Figure has the method set_size_inches(), with which we can change the existing image’s width and height (measured in inches). Similarly, the method set_dpi() specifies the number of dots per inch. They’re accompanied by the getters get_size_inches() and get_dpi(). Here’s an example of how to use them:
# Create a figure with a bar plot
figure = plt.figure(figsize=(5, 4), dpi=150)
plt.bar(['A', 'B', 'C', 'D'], [1, 2, 3, 4])

# Print its width, height, and dpi
print('Initial values')
print('Width and height =', figure.get_size_inches())
print('DPI =', figure.get_dpi())

# Change its width, height, and dpi
figure.set_size_inches((4, 4))
figure.set_dpi(50)

# Check if the values have been changed
print('After the change')
print('Width and height =', figure.get_size_inches())
print('DPI =', figure.get_dpi())
Here’s the result:
Initial values
Width and height = [5. 4.]
DPI = 150

After the change
Width and height = [4. 4.]
DPI = 50
4. Setting the Parameter dpi When Saving a Figure to a File
We can set the pixel size of the image file when saving a figure to it. For that, we can set the parameter dpi of the function plt.savefig() or the method savefig() of the class Figure:
import matplotlib.pyplot as plt
...
plt.savefig(filename, figure, dpi)
figure.savefig(filename, dpi)
Here, the variable figure is a reference to an existing figure. The parameter dpi controls the pixel size of the image file:
- If dpi=’figure’, Matplotlib sets the dpi for the image file to the value figure.get_dpi()
- If dpi is a number, that value is used
5. Changing the Default Settings
If we’re about to create many figures with the same width, height, and/or dpi requirements, we can change the default settings to avoid setting the size parameters for every image.
The default Matplotlib settings are in the object matplotlib.pyplot.rcParams. This object is an instance of the class RcParams and acts like a dictionary by allowing us to access and modify the settings using the key-value syntax.
There are three parameters we can change via rcParams. Here are their keys:
- ‘figure.figsize’ for setting the default width and the height of created figures
- ‘figure.dpi’ for setting the default dpi of created figures
- ‘savefig.dpi’ for setting the default dpi when saving to a file
By default, these values are:
- rcParams[‘figure.figsize’] = (6.4, 4.8)
- rcParams[‘figure.dpi’] = 72
- rcParams[‘savefig.dpi’] = ‘figure’
If we want other values, all we have to do is change them before drawing any images. For example:
import matplotlib.pyplot as plt

plt.rcParams['figure.figsize'] = (8, 7)
plt.rcParams['figure.dpi'] = 100

figure = plt.figure()

print('Width and height:', figure.get_size_inches())
print('DPI:', figure.get_dpi())
As we see, the settings are successfully changed:
Width and height: [8. 7.]
DPI: 100.0
Restarting the Python session restores the old default values (unless we change the configuration files).
6. Conclusion
In this article, we showed four ways to change a Matplotlib figure’s size in width, height, and pixels. We can set the sizes during figure creation, but if there are many figures, it’s a good idea to set the global default settings to avoid setting the size parameters to the same values each time when creating a new image.