1. Introduction
Matplotlib is a popular Python library for creating static, animated, and interactive visualizations. It provides an object-oriented API for embedding plots into applications and supports multiple backends for rendering in different environments. With Matplotlib, users can generate high-quality figures in various formats, making it an essential tool for data analysis and visualization in general.
Sometimes, rather than showing plots interactively, we may need to save them as image files. Fortunately, Matplotlib provides a simple and flexible way to achieve this. In this tutorial, we’ll explore how to save a Matplotlib plot as an image file instead of displaying it on the screen.
2. Installing Matplotlib
To install Matplotlib, we can use the pip command, which is the recommended way to install Python packages:
$ pip install matplotlib
After installation, we can check if Matplotlib is correctly installed by running a small Python script:
import matplotlib
print(matplotlib.__version__)
If the installation was successful, it will print the Matplotlib version that we installed.
3. Saving a Matplotlib Plot
To save a Matplotlib plot as an image file, we need to use the savefig() function. This function allows us to save figures in various formats, such as PNG, JPG, SVG, and PDF. Below is a basic example of how to save a plot instead of displaying it:
import matplotlib.pyplot as plt

# Create sample data
x = [1, 2, 3, 4, 5]
y = [10, 20, 25, 30, 40]

# Create the plot
plt.plot(x, y, marker='o', linestyle='--', color='b', label='Data')
plt.xlabel('X-axis')
plt.ylabel('Y-axis')
plt.title('Sample Plot')
plt.legend()

# Save the plot as a PNG file
plt.savefig('plot_matplotlib.png')
When we open the file, it looks like this:
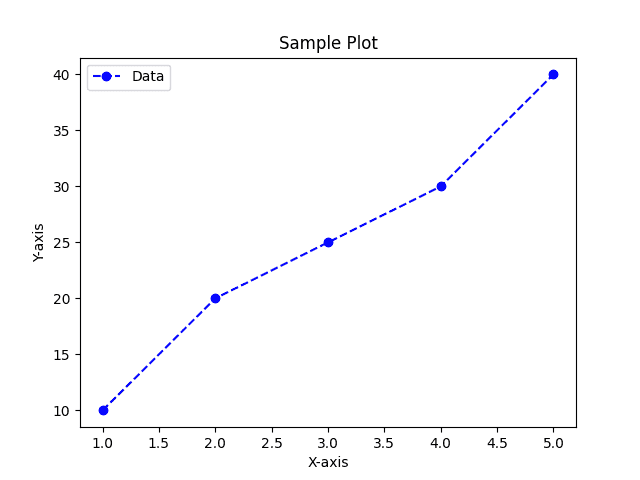
In this example, the savefig() function saves the figure as a PNG file in the current working directory. If no path is specified, it saves it in the script’s execution directory.
3.1. Specifying Image Format
Matplotlib allows customization of the image format. We can explicitly specify the file format by changing the file extension or using the format parameter:
plt.savefig('plot.jpg', format='jpg')
Matplotlib supports multiple image formats, including:
- PNG – lossless compression, good for web use
- JPG – compressed format; useful for photos, but may lose detail
- TIFF – high-quality format, often used in printing
- WebP – modern compressed format, good for web performance
- PDF – common for documents and high-quality output
In addition to specifying image format, we can define image quality.
3.2. Specifying Image Quality
To specify image quality in Matplotlib, we can use the dpi parameter:
plt.savefig('plot.jpg', dpi=300)
DPI (dots per inch) controls the resolution of the saved image. A higher DPI results in better image quality but increases file size. Here are some common DPI values:
- 72 DPI – suitable for web use with smaller file sizes
- 150 DPI – medium-quality images, often used for documents
- 300 DPI – high-quality images, suitable for printing
- 600+ DPI – very high resolution, used for professional prints
The default DPI in Matplotlib is 100.
3.3. Saving an Image With a Transparent Background
By default, saved images have a white background. However, we can make the background transparent using the transparent parameter:
plt.savefig('plot_transparent.png', transparent=True)
This is particularly useful when we need to overlay the plot with other images or use it in presentations without a white background.
4. Conclusion
In this article, we’ve covered various ways to save Matplotlib plots as image files instead of displaying them. We explored the savefig() function, different file formats, DPI settings, and transparency options. By using these techniques, we can effectively generate high-quality plots for documentation, reports, or online sharing.