1. Introduction
In this tutorial, we’ll explain the difference between two sampling strategies: stratified and cluster sampling.
2. Stratified Sampling
One of the goals of stratified sampling is to ensure the resulting sample is representative.
In this strategy, we first identify the key characteristics by which our sample should represent the entire population. Then, we split the population into non-overlapping groups (we call them strata) and take a sample from each group (stratum) independently from other strata:
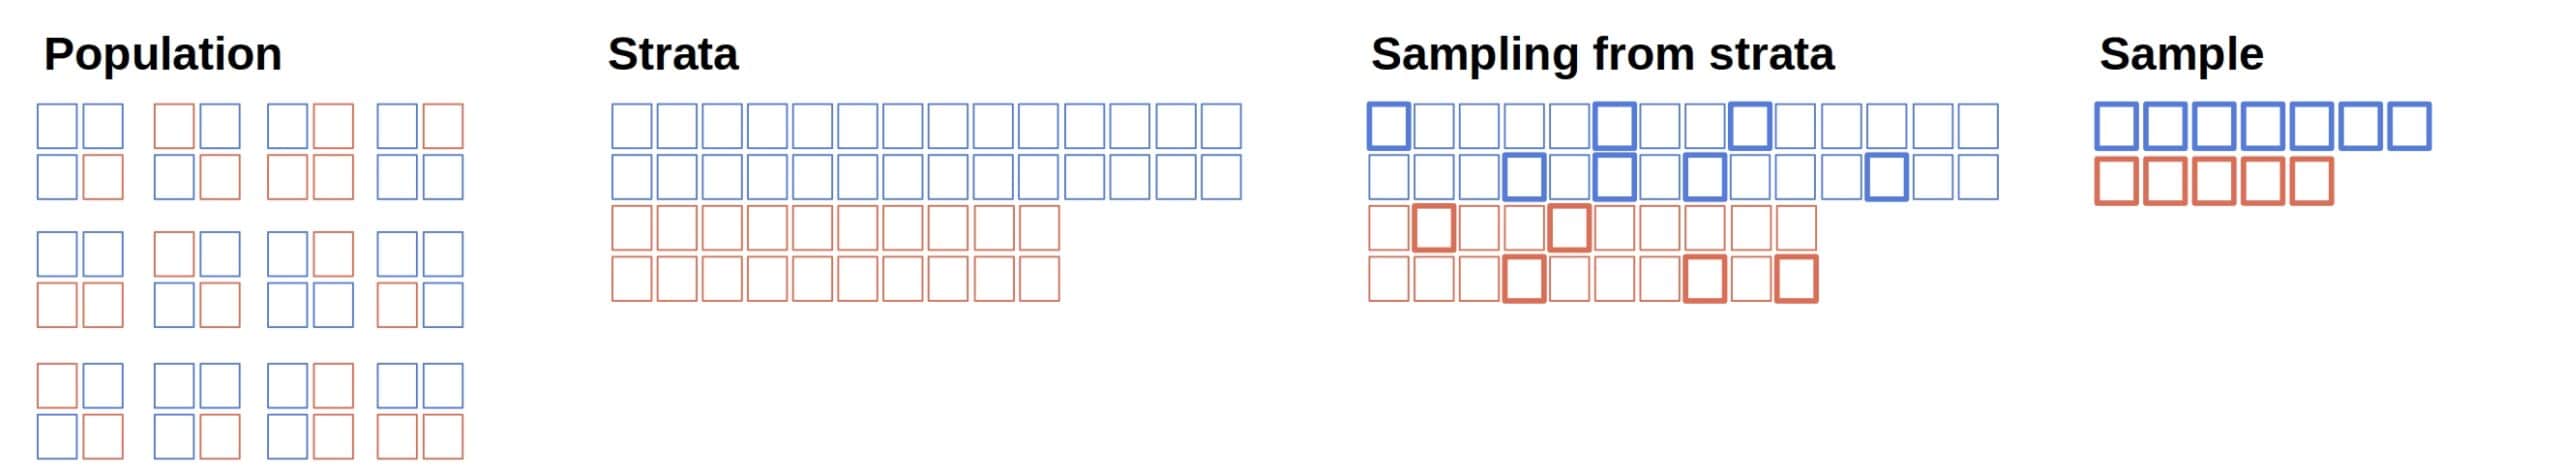
Our final sample is a union of individual stratum samples. We expect it to be more representative than a random sample taken without considering the structure of the population.
3. Cluster Sampling
Cluster sampling also uses a population split, but in this case, the groups (called clusters) are formed independently of any survey. The division is “natural” because clusters emerge spontaneously.
For instance, county residents are naturally grouped into residential sectors such as neighborhoods or even buildings in densely populated urban areas. So, each sector is a cluster in this split.
To form a sample, we randomly select a few clusters and include all their elements in our sample:
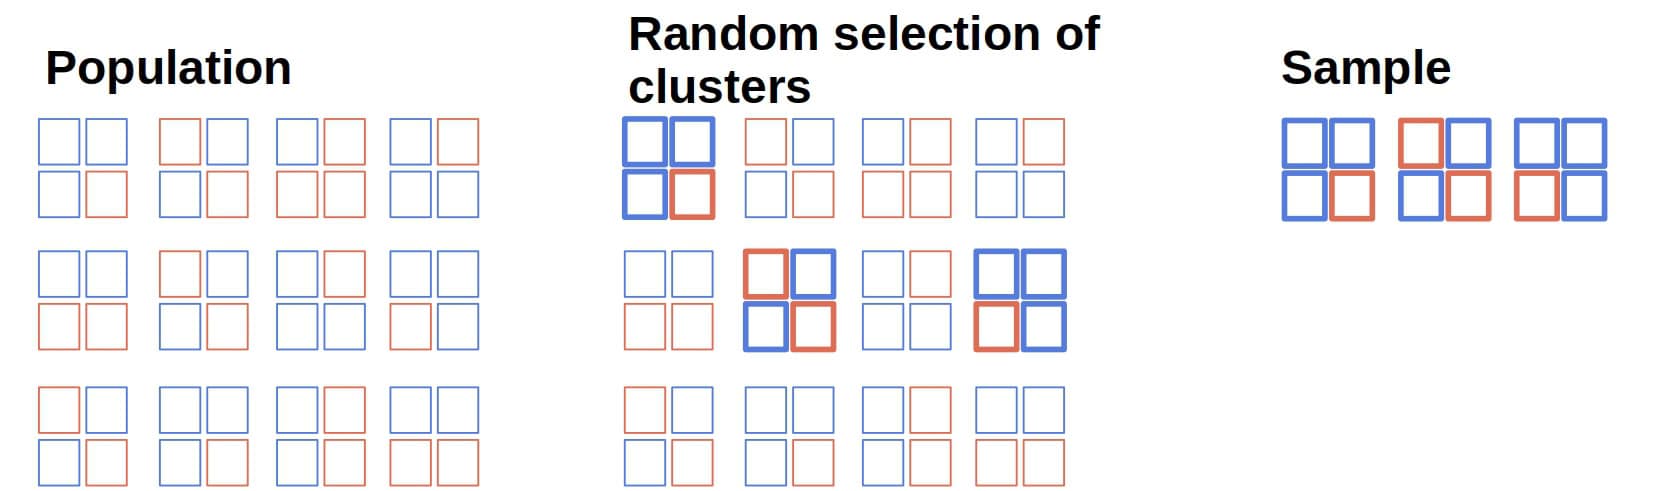
Let’s say there are 3000 sectors in our county. We can randomly select ten sectors for our survey and ask all their residents to disclose their salaries.
4. Comparison
The main differences between stratified and cluster sampling are the group definition, the desired variability breakdown, and the way they form samples:
Difference
Stratified Sampling
Cluster Sampling
Group name
Stratum
Cluster
Group definition
Researchers define strata to be internally homogeneous.
Researchers use an existing split of the population into clusters.
Ideal within-group variability
Low
High
Ideal between-group variability
High
Low
How do we form a sample?
Draw a few elements from each stratum.
Select a few clusters randomly and include all their elements.
Cost of sampling
Can be higher
Usually lower
4.1. Definition
In stratified sampling, researchers define the criteria for splitting the entire population of interest into internally homogeneous, mutually dissimilar groups called strata. The goal is to get a representative sample and reduce the variance of measurements.
The criteria for dividing the population into strata (i.e., stratifying it) should be meaningful and related to our survey goals. For instance, if we want to estimate the average salary in a county, it makes sense to stratify the working population by education level but not by unrelated factors, such as favorite movie genre.
In cluster sampling, we use already-existing groups, such as neighborhoods in a city for demographic surveys and classes in a school for educational ones. The groups (called clusters) aren’t homogeneous by design, as we aim to achieve with stratified sampling.
4.2. Within- and Between-Cluster Variability
Unlike the stratified approach, cluster sampling works best if clusters are similar to one another but internally heterogeneous. So, variability should be high within a cluster but low between clusters.
In contrast, variability should be low within a stratum but high between strata. This is another criterion to consider when defining strata.
4.3. Forming a Sample
Finally, the way we form a sample differs in these two strategies. In stratified sampling, we take a random sample from each stratum and unify all those samples into the main sample.
There are several ways to determine the number of elements to draw from each stratum. We can set the sample from each stratum to be proportional to the stratum’s size, but we can also draw larger samples from more variable strata.
In cluster sampling, we randomly select a few clusters and include all their elements in our main sample.
4.4. Cost
Cluster sampling can reduce costs because spatial (or temporal) proximity drives cluster formation, which is not necessarily the case with strata.
For example, once we’re in a residential building with many apartments, it makes sense to ask all the residents to answer a few questions as it doesn’t take much time to go from one apartment to another. So, once in a building, why not ask everyone for the data we need?
In contrast, what if we determined that to get a stratified sample, we have to drive to 110 residential sectors all over the county and that, in some sectors, we have only one person to survey? Driving all the way just for one survey response isn’t cost-justified.
5. Example
Let’s say we want to estimate the average height of a plant species endemic to a mountain. The plant species comprises three subspecies: the blue, red, and yellow.
Let’s assume that 40% of these plants are red, 30% yellow, and 30% blue. For the sake of the example, let’s say that their heights follow three (unknown to us) normal distributions depending on the subspecies:
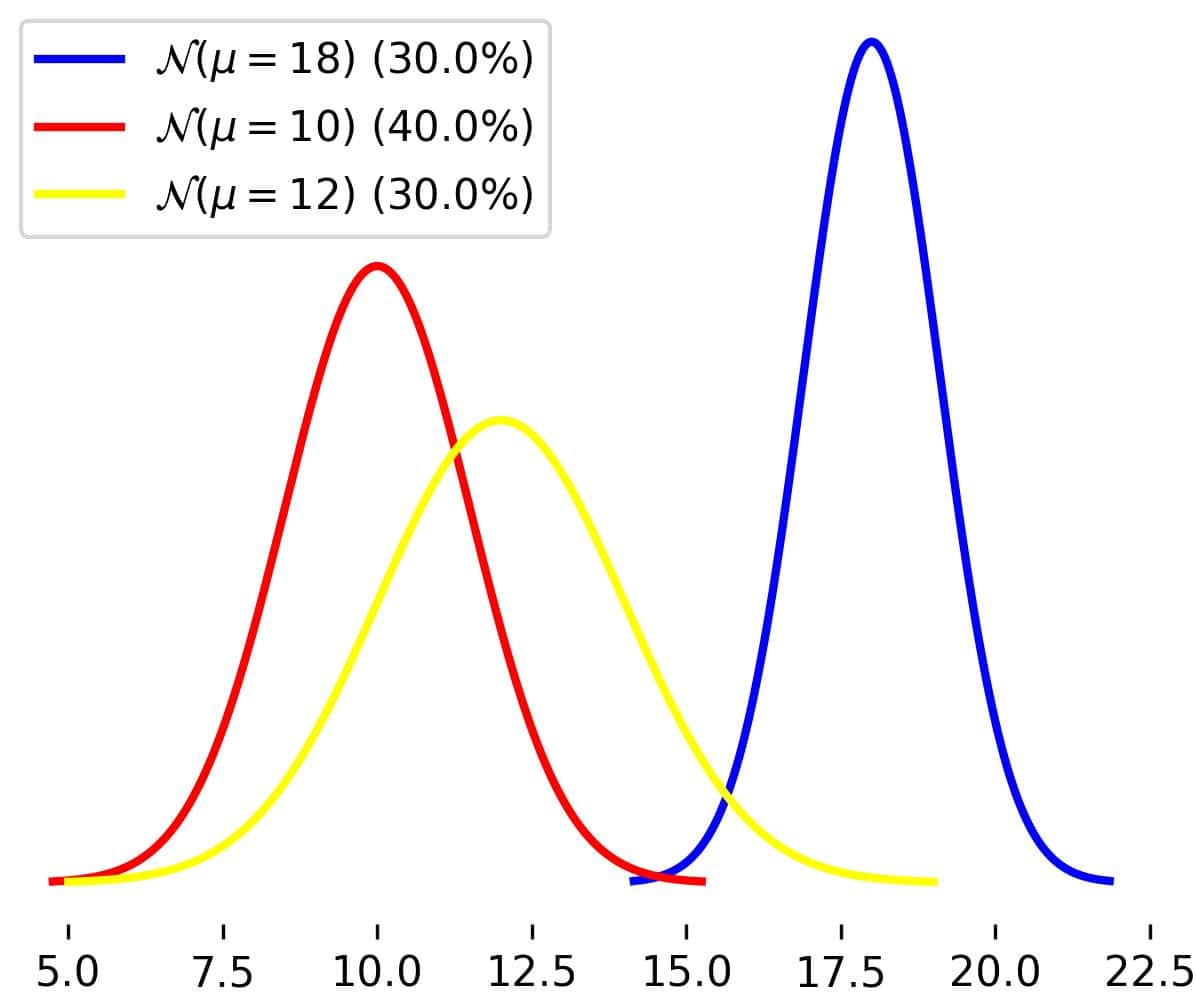
The overall average is:
![[0.4 \times 10 + 0.3 \times 12 + 0.3 \times 18 = 13]](/wp-content/ql-cache/quicklatex.com-d284e6c3f5081cf047cdb27a80ef54bf_l3.svg "Rendered by QuickLaTeX.com")
Let’s say we can sample 30 plants in total.
5.1. Simple Random Sample
Without stratification and clustering, our sample might include only one subspecies, making our mean estimate unreliable.
Here’s how a sample may look like if we don’t consider subspecies:
18.65, 16.2, 19.19, 19.99, 15.75, 19.92, 18.67, 16.54, 19.01, 18.31, 16.35, 18.76, 16.24, 10.36, 10.96, 8.67, 8.82, 11.29,
 6.81, 11.63, 9.84, 9.2, 13.07, 10.8, 13.28, 9.29, 15.06, 12.96, 12.6, 18.4
The mean is 14.22.
If we took 10,000 random samples from a population defined like this, the mean estimates would vary around the true population mean with a standard deviation of approximately 0.684:
The estimates fluctuate around the true mean. Can we increase efficiency, i.e., reduce their variance?
5.2. Stratified Sampling: Estimate of the Average
If we opt for stratification sampling, the subspecies will be our strata, so we’ll sample 9 blue plants, 12 red, and 9 yellow. For instance:
Subspecies (stratum)
Stratum Sample
Stratum Sample Mean
Blue
18.01, 16.68, 18.0, 17.34, 17.66, 18.76, 18.61, 18.12, 18.26
17.94
Red
11.65, 8.05, 11.5, 9.59, 9.72, 9.56, 9.67, 10.93, 12.73, 9.18, 8.96, 9.31
10.07
Yellow
9.39, 10.92, 12.63, 11.28, 14.06, 13.04, 12.38, 11.22, 13.36
12.03
The overall mean estimate is:
![[0.3 \times 17.94 + 0.4 \times 10.07 + 0.3 \times 12.03 \approx 13.02]](/wp-content/ql-cache/quicklatex.com-fdd9f29ecf200ba2c0b5a60ce385a23c_l3.svg "Rendered by QuickLaTeX.com")
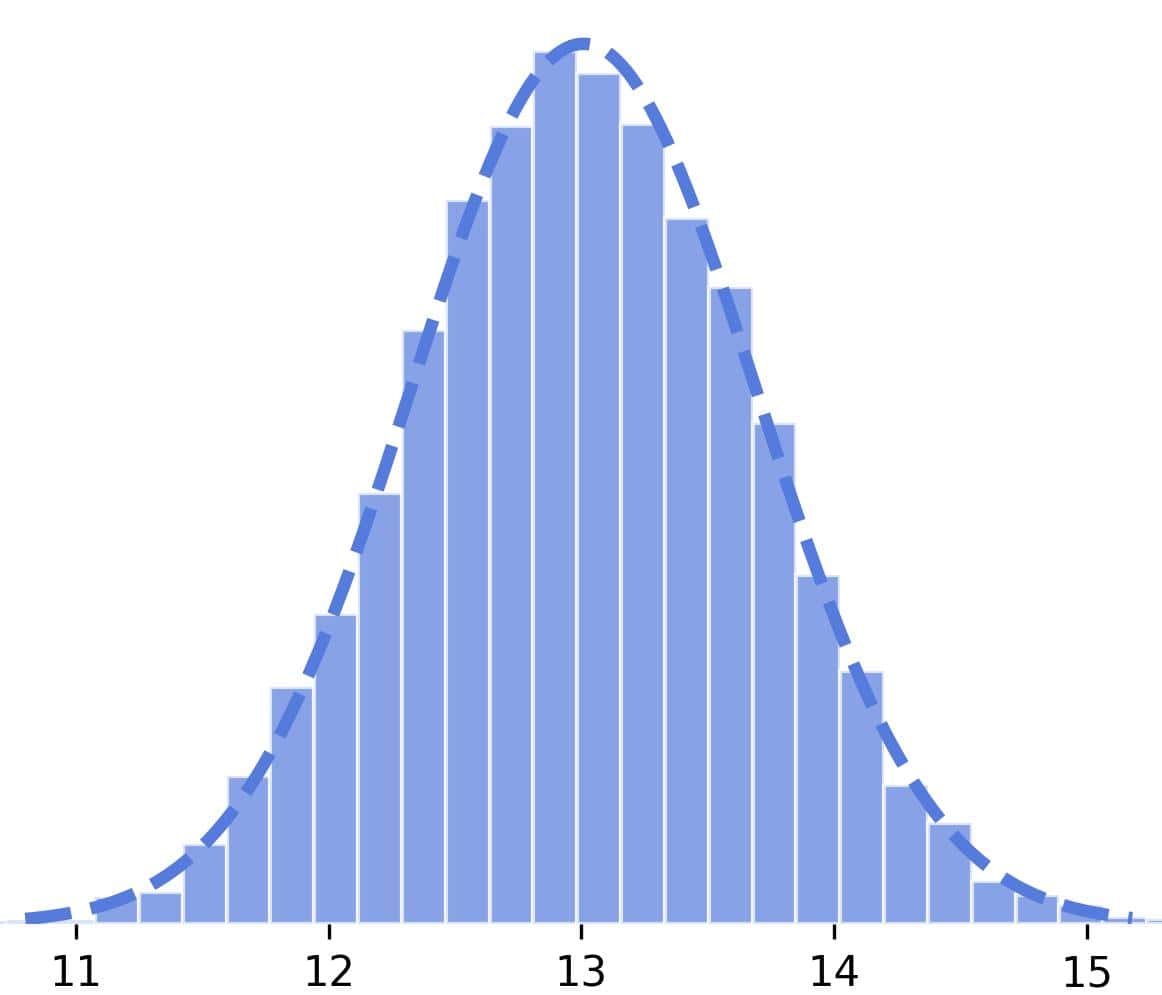
If we repeated this experiment 10,000 times, our mean estimates would fluctuate around the true mean much less than without stratification:
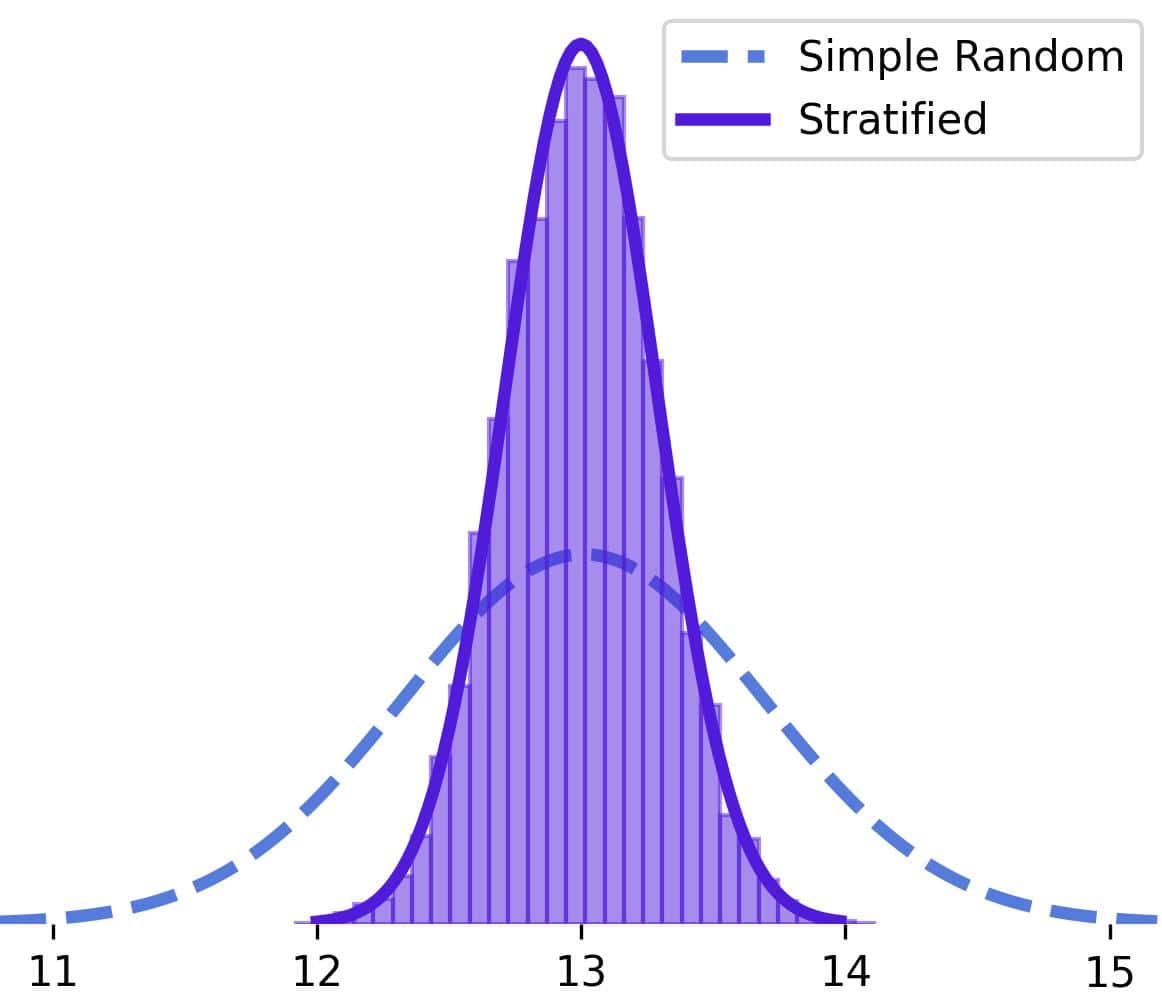
The standard deviation of the stratified means is 0.287, less than half the deviation for simple random sampling.
5.3. Cluster Sampling
Let’s say each field contains ten specimens of this species. So, we can consider fields to be our clusters.
If the proportions of subspecies in each field correspond to the overall proportions in the entire population, we’ll get the same results as in stratified sampling.
However, that’s not realistic. It’s more likely that the field proportions will vary. For instance, if we take three clusters (fields):
Cluster Number
Cluster
Cluster Mean
1
16.98, 17.62, 7.73, 10.12, 10.13, 10.44, 10.53, 11.14, 12.29, 16.04
12.302
2
16.26, 16.5, 18.95, 20.04, 6.72, 9.03, 9.63, 13.34, 15.42, 16.71
14.26
3
16.68, 17.92, 19.71, 10.02, 10.36, 10.36, 11.71, 13.07, 11.91, 12.81
13.455
Because the clusters are of the same size, the overall mean is:
![[\frac{1}{3}(12.302 + 14.26 + 13.455) = 13.339]](/wp-content/ql-cache/quicklatex.com-b01c67541b467287078c6622d3b44f84_l3.svg "Rendered by QuickLaTeX.com")
If we repeated this sampling experiment 10,000 times, we’d find that the distribution of the overall mean estimates is centered at the population mean with a variance of approximately 0.467:
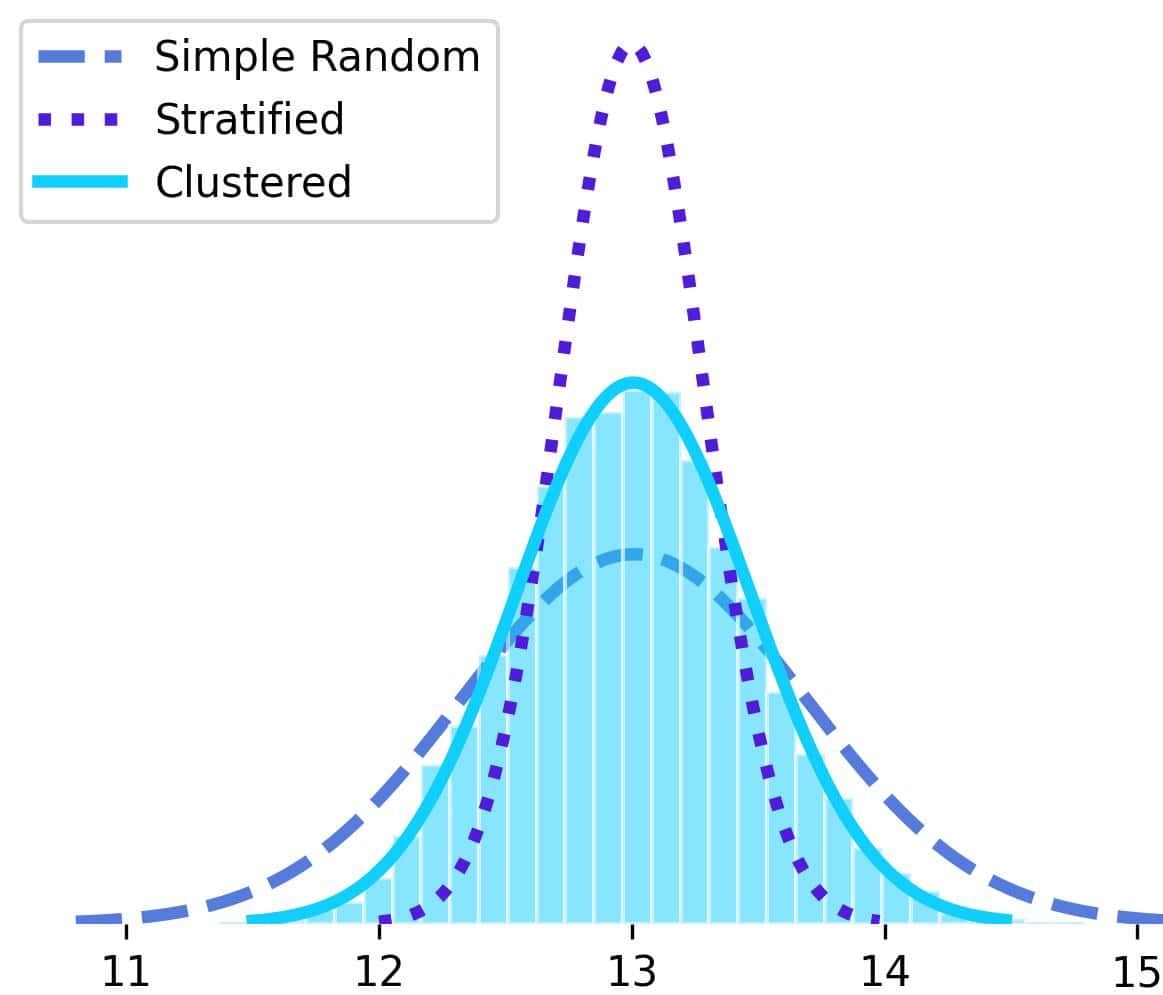
In this simulation, the cluster sampling estimator was less variable than the mean in simple random sampling but more variable than the stratified mean estimator.
6. Conclusion
In this article, we explained stratified and cluster sampling and their differences.
Stratified sampling splits a population into homogeneous subpopulations and takes a random sample from each. Cluster sampling uses an existing split into heterogeneous groups and includes all the elements of randomly selected groups in the sample.